In the evening of the 5th of October, between 20:00 and 20:40 CET, a strong 3 Hz oscillation of power frequency and voltage was detected from the PQopen measurement system in DE/Stade.
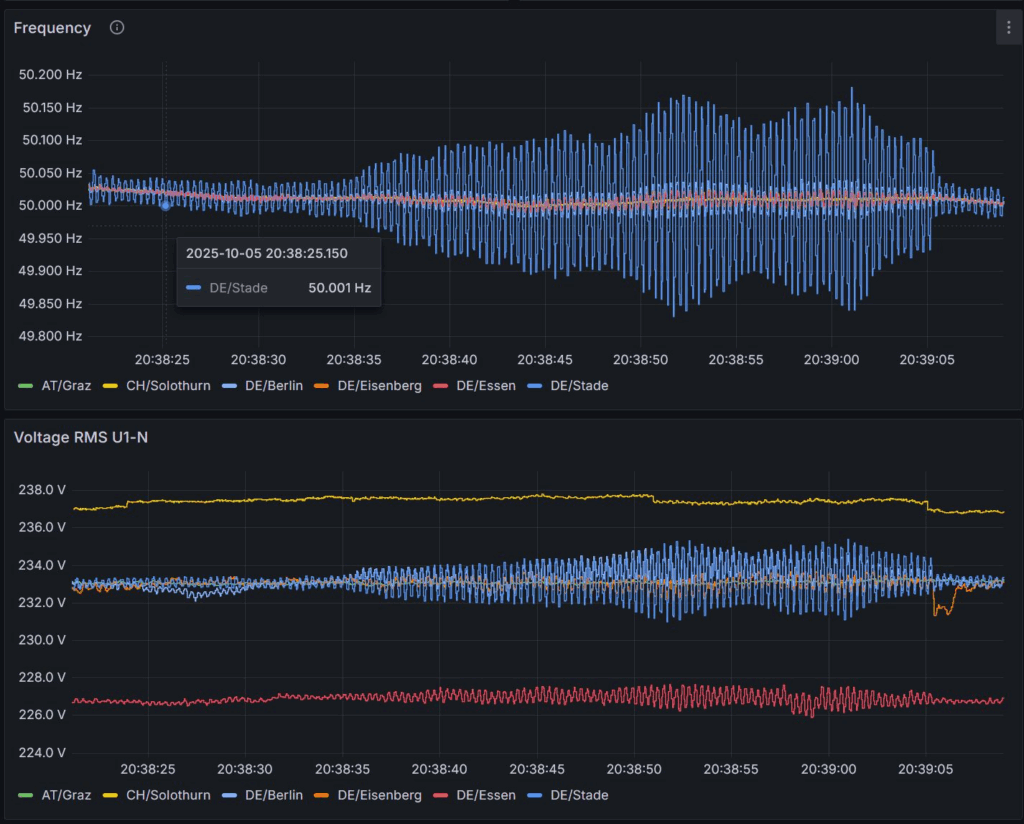
In this article, I want to show some detail graphs of the recorded data in comparison to two other measurement stations in Germany (DE/Essen and DE/Berlin). This should illustrate, that it was not a purely local phenomenon.
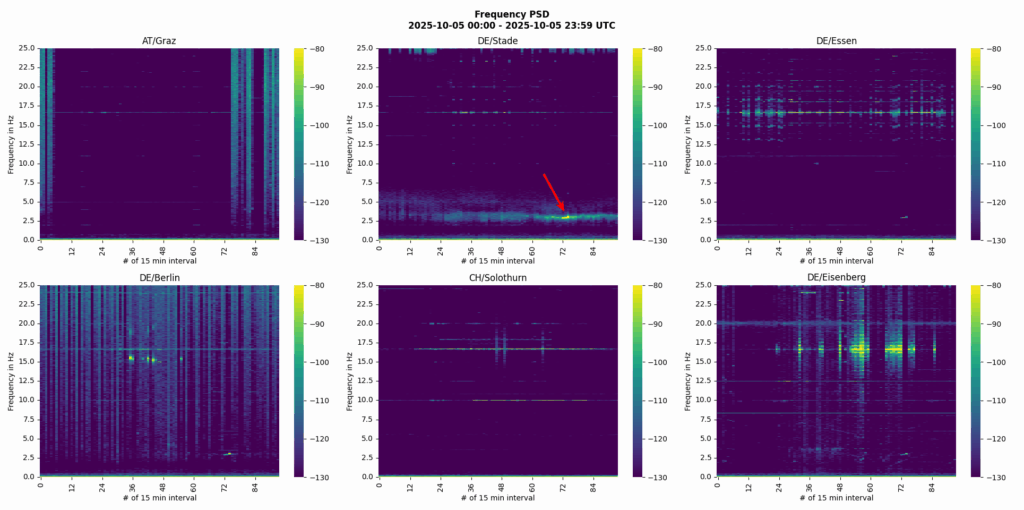
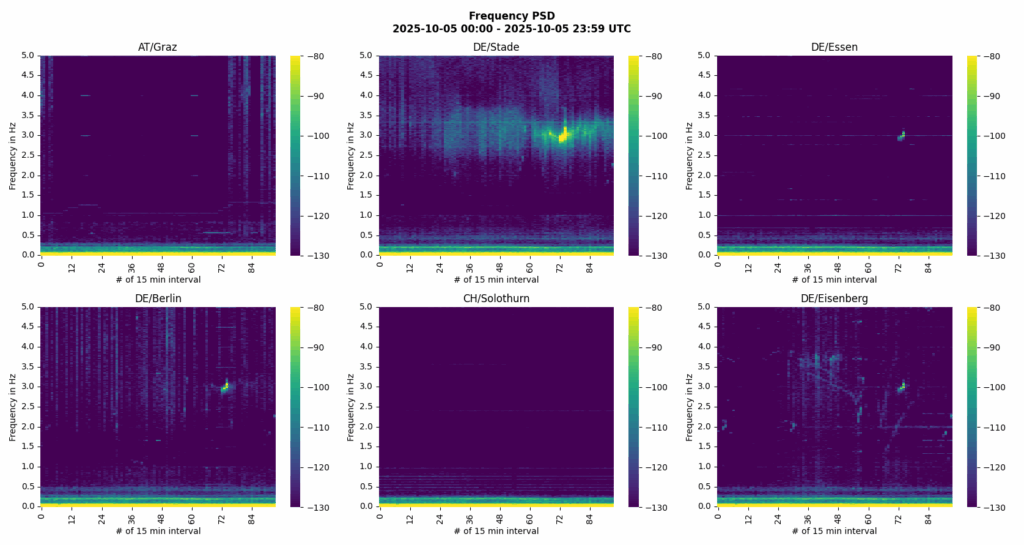
Power Spectrum Density (Full Day)
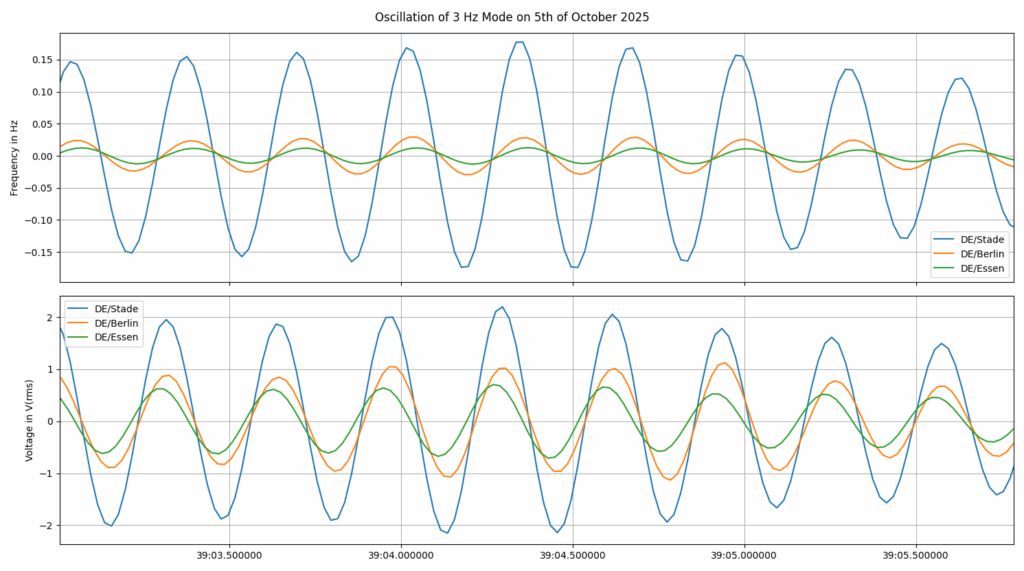
Time Domain Signal (19:50 to 21:00)
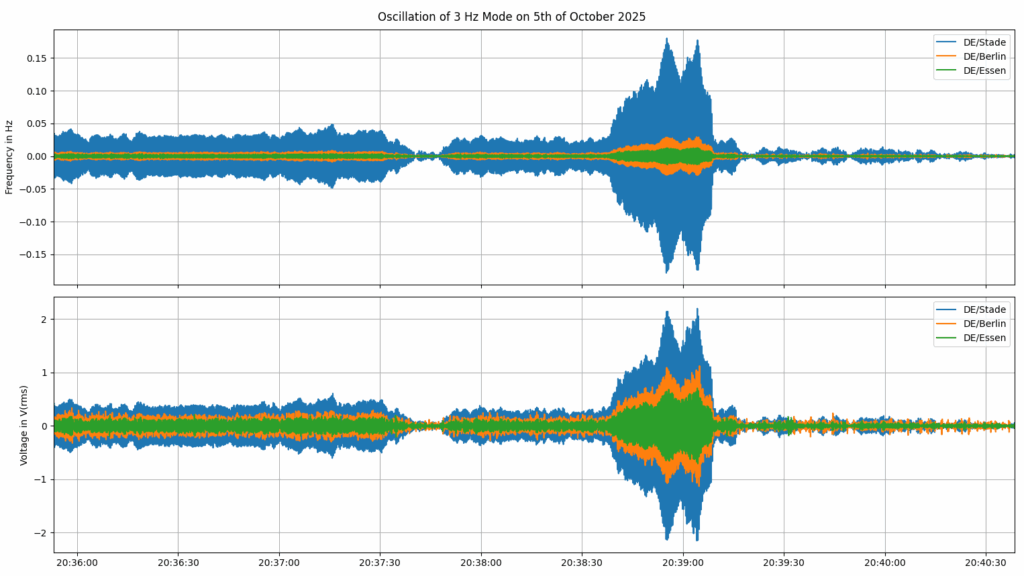
Bandpass filtered Cycle-by-Cycle data
Now, we want to see some details and zoom in to the area of interest. First of all, we lets have a look at the C-b-C data, filtered with a bandpass filter, to get rid of the DC part and unwanted glitches.
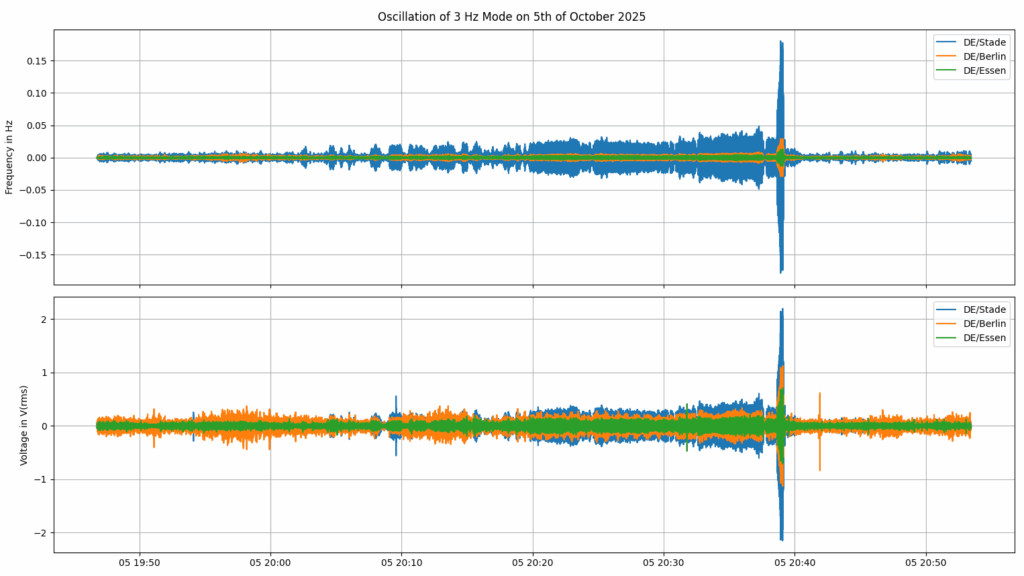
One can see, that a short time after 20:00, the oscillation was significant the first time, but was coming and going until 20:20. Afterwards, the oscillation was at nearly constant magnitude until 20:35, when it suddenly rushed up.
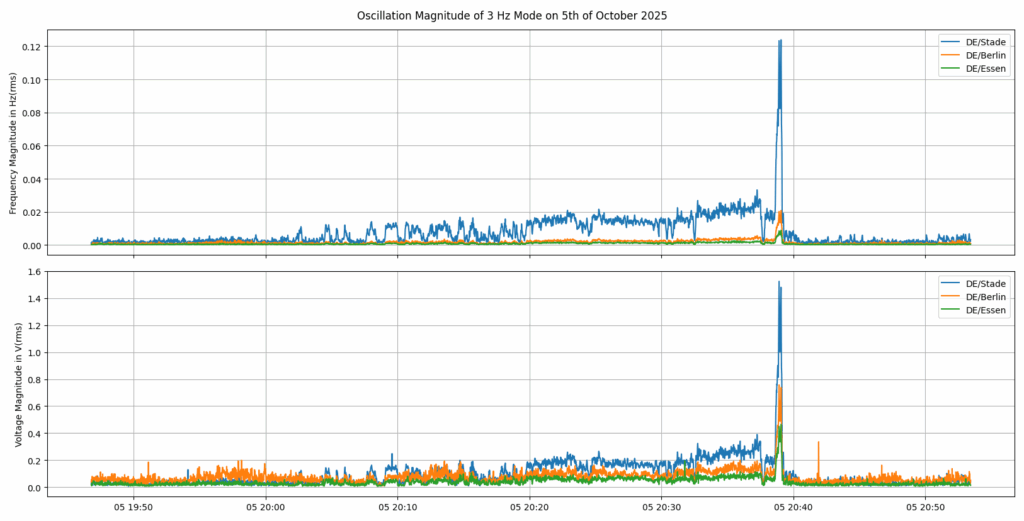
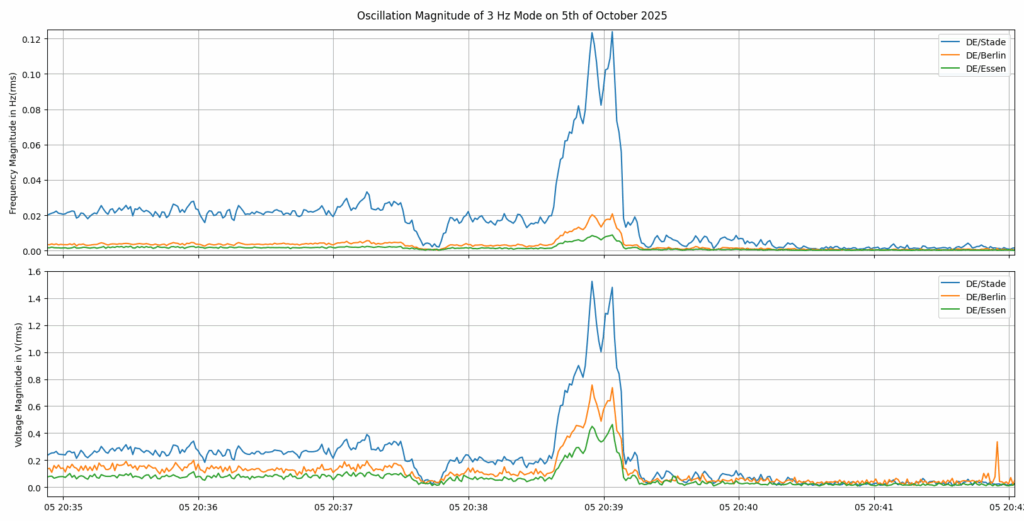
Aggregated Magnitude
After aggregating the waveform of the oscillation to an rms-value, it is easier to follow the path of magnitude. One interresting detail is the stronger affect on the voltage on the remote stations in comparison to the frequency.
XY-Plot of Frequency and Voltage Oscillation
To show the correlation between the frequency and voltage oscillation, I tried to arrange a series of xy-plots of different time frames. One can see the growing ellipsis until the max.
Conclusion
It could be shown, that the oscillation was visible also on other measurement stations which reduces the possibility of a wrong measurement. Maybe there is an expert out there, who can do some more interpretation of a possible cause with the provided analysis.
Files used for analysis are available here: https://archive.pqopen.com/daily/
Yours, Michael