Welcome to the 4th report this year of the data acquired with the PQopen measurement network.
Summary
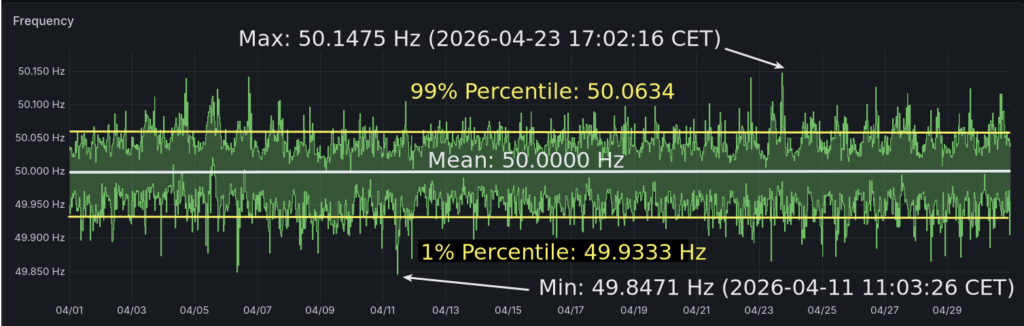
In the summary, the 1s-mean value of the mains frequency is evaluated.
| Statistics | Value and occurance |
|---|---|
| MIN | 49.8471 Hz (2026-04-11 11:03:26 CET) |
| 1% Percentile | 49.9333 Hz |
| MEAN | 50.0000 Hz |
| 99% Percentile | 50.0634 Hz |
| MAX | 50.1475 Hz in AT/Graz (2026-04-23 17:02:16 CET) |
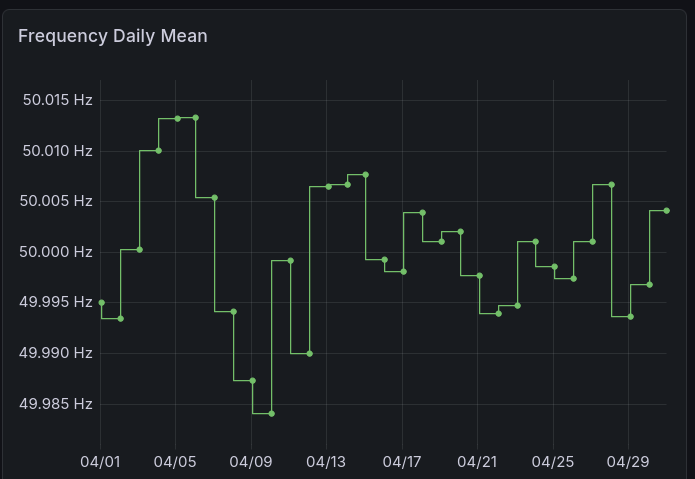
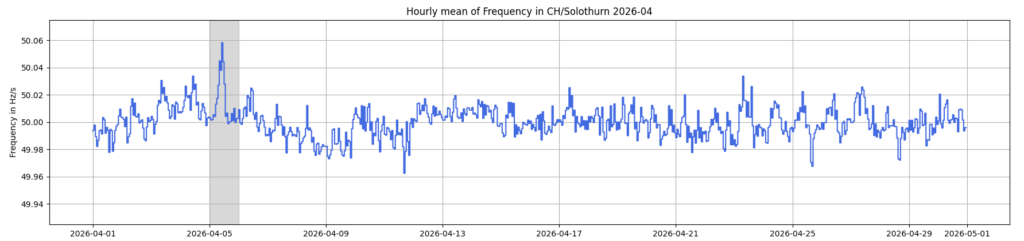
Daily Mean
The daily mean can give you an overview of the „accuracy“ of the grid control and their effect on grid synchronized clocks. April was very dynamic in this case, especially at the beginning of the month.
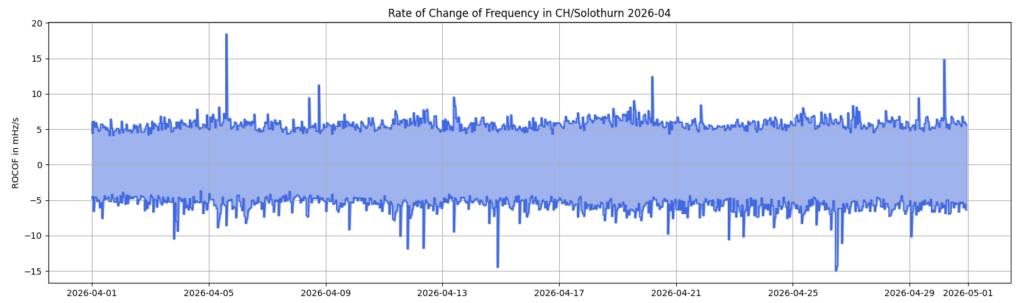
Rate of Change of Frequency (ROCOF)
The ROCOF is an indicator for potential events and the steadiness of the frequency. The higher the value, the more disturbances are at work (oscillations, transients…).
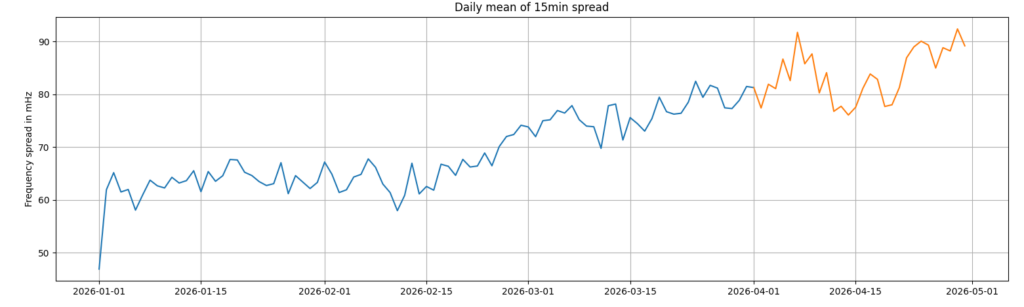
Frequency Spread
I introduced the metric „Frequency Spread“ in the posting, where I analysed the dynamic of the frequency the past 15 years. From now on, I want to use this metric in this report.
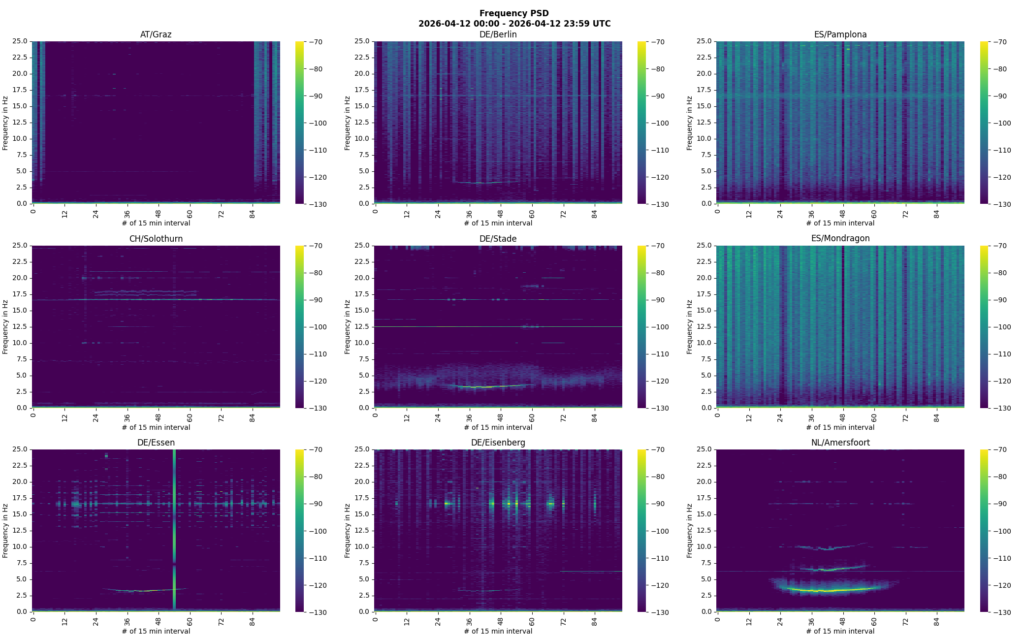
Inter-Area oscillations
The inter-area oscillations is a long-known phenomenon resulting from the wide area of interconnected countries. In Spain, two modes can be detected, the east-center-west and the east-west mode.
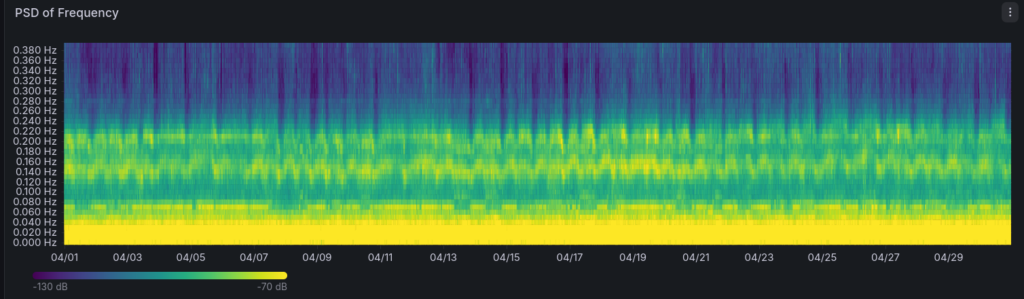
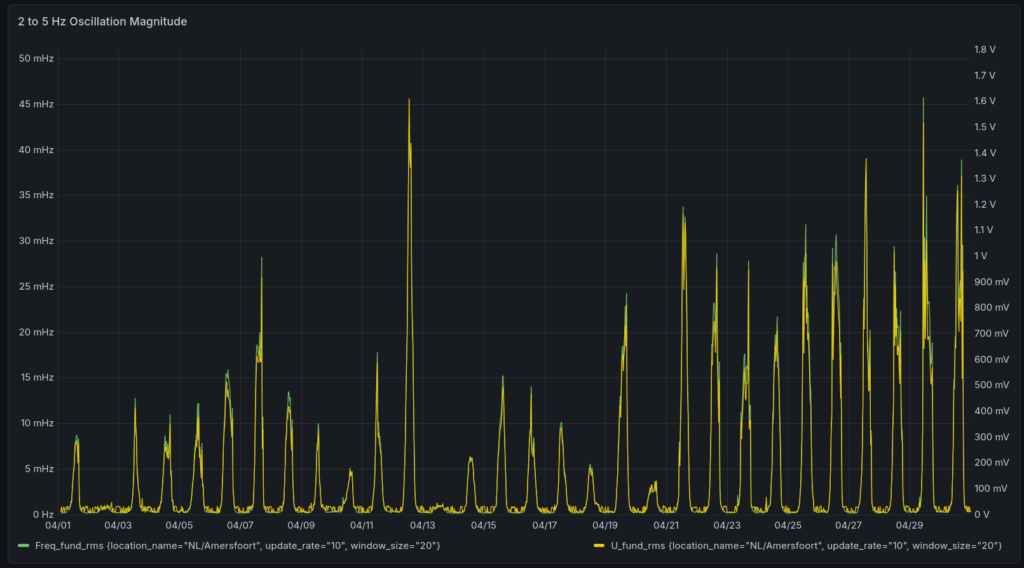
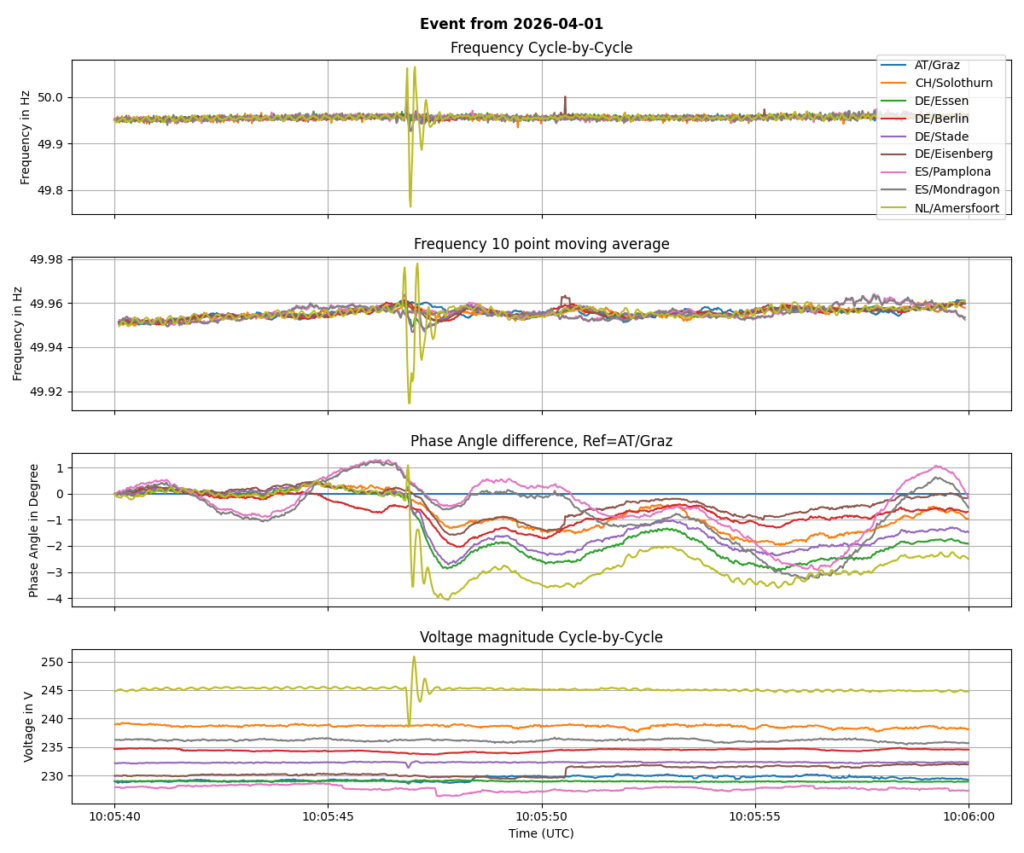
Oscillations in the Netherlands
Other Abnormalities
More deviations of frequency below 49.9 Hz and over 50.1 Hz, a rise of 200%+ can be noticed compared to previous month:
| < 49.9 Hz | > 50.1 Hz | |
|---|---|---|
| Count of threshold crossings | 83 (+51) | 72 (+34) |
| Number of seconds below/above | 2079 (+1528) | 1939 (+1575) |
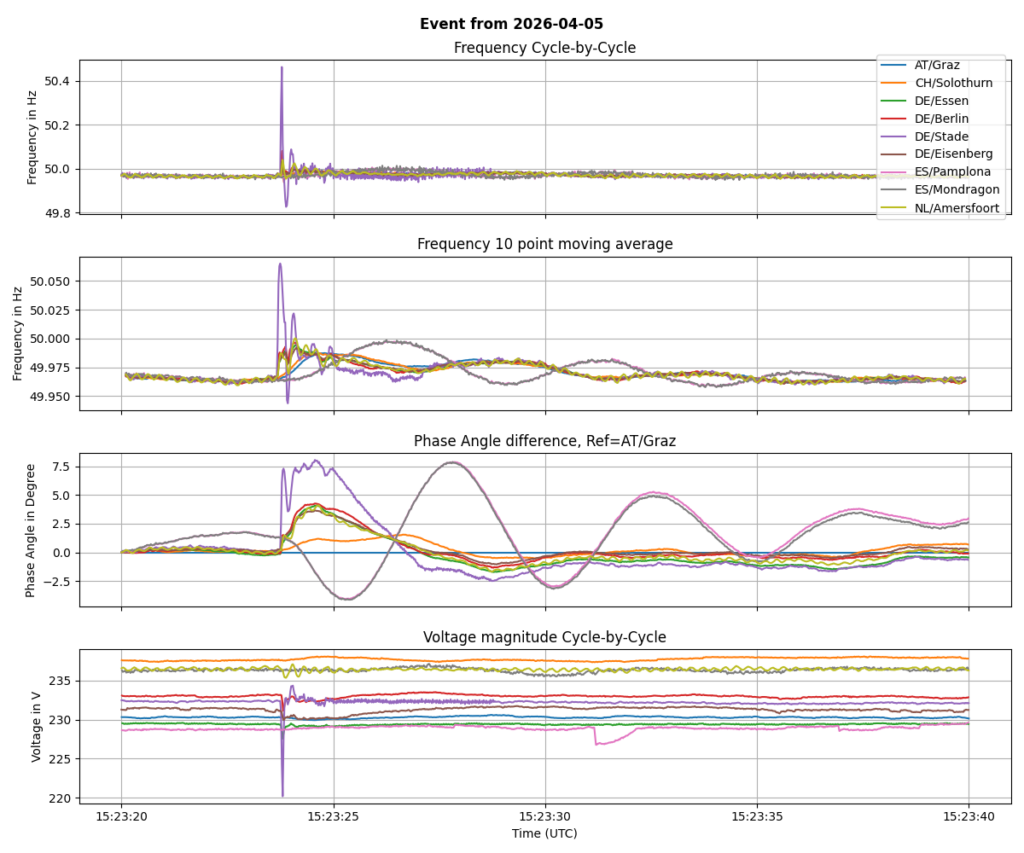
Phase of high frequency in the first days of the month. Especially on 5th of April, the frequency was higher than usual during the day:
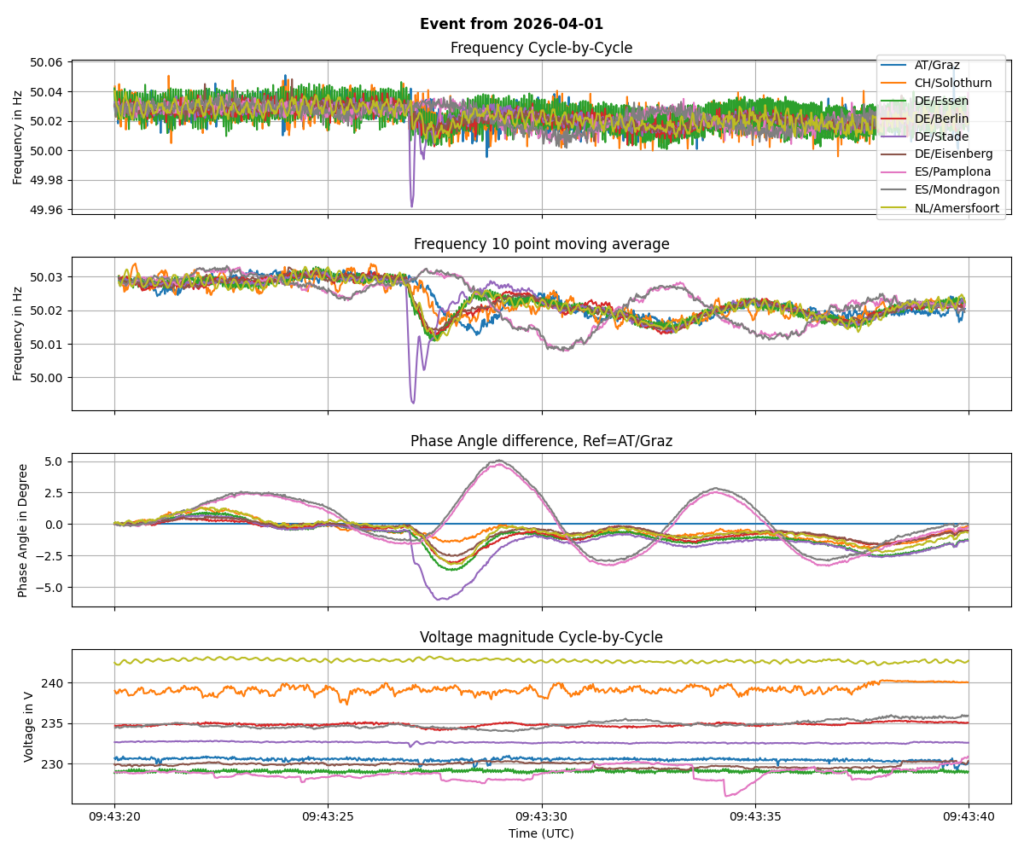
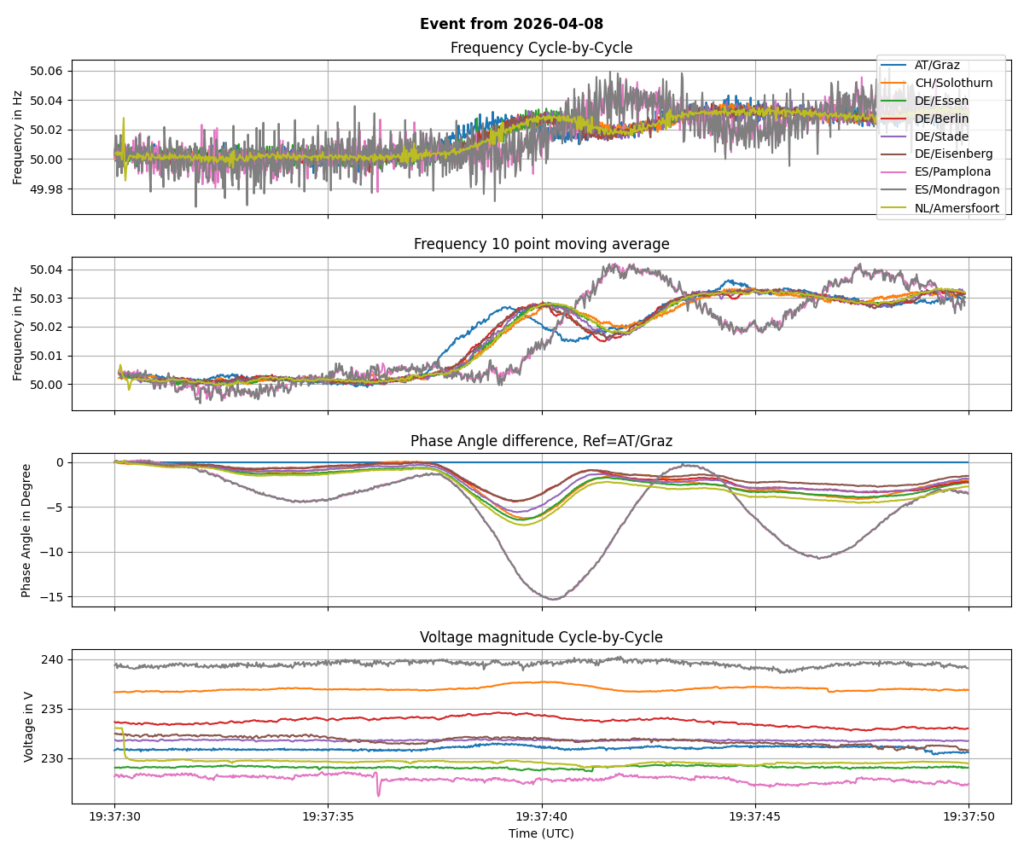
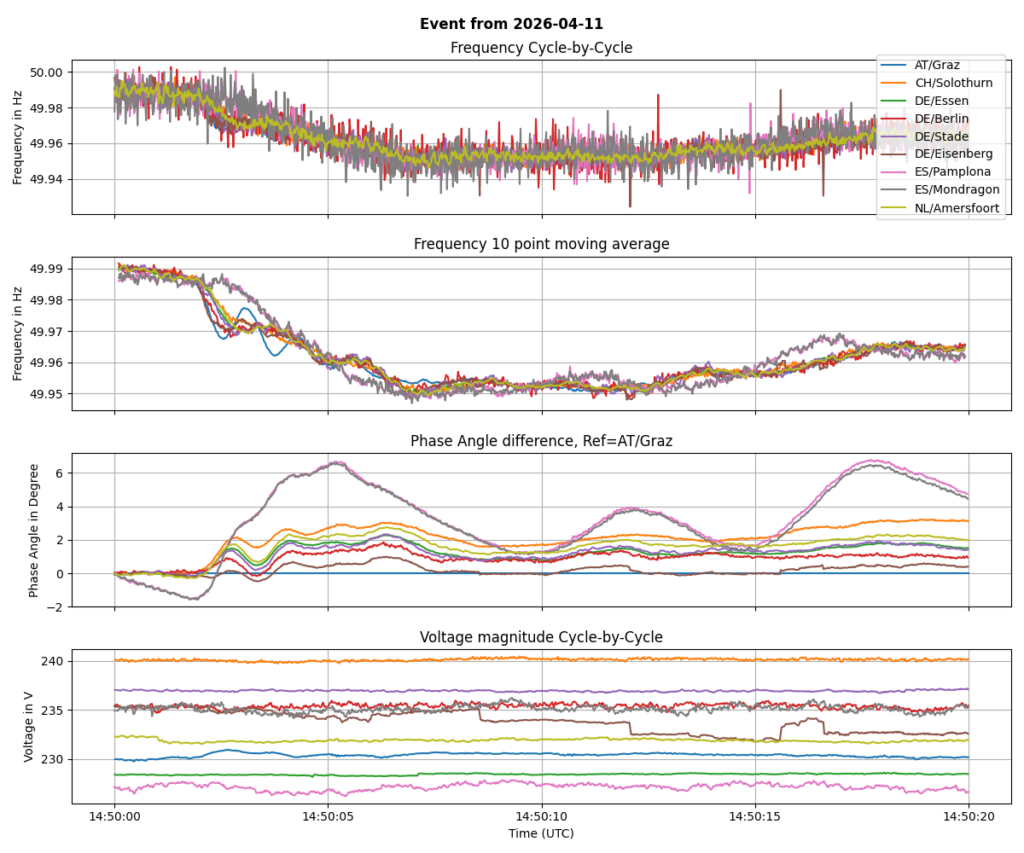
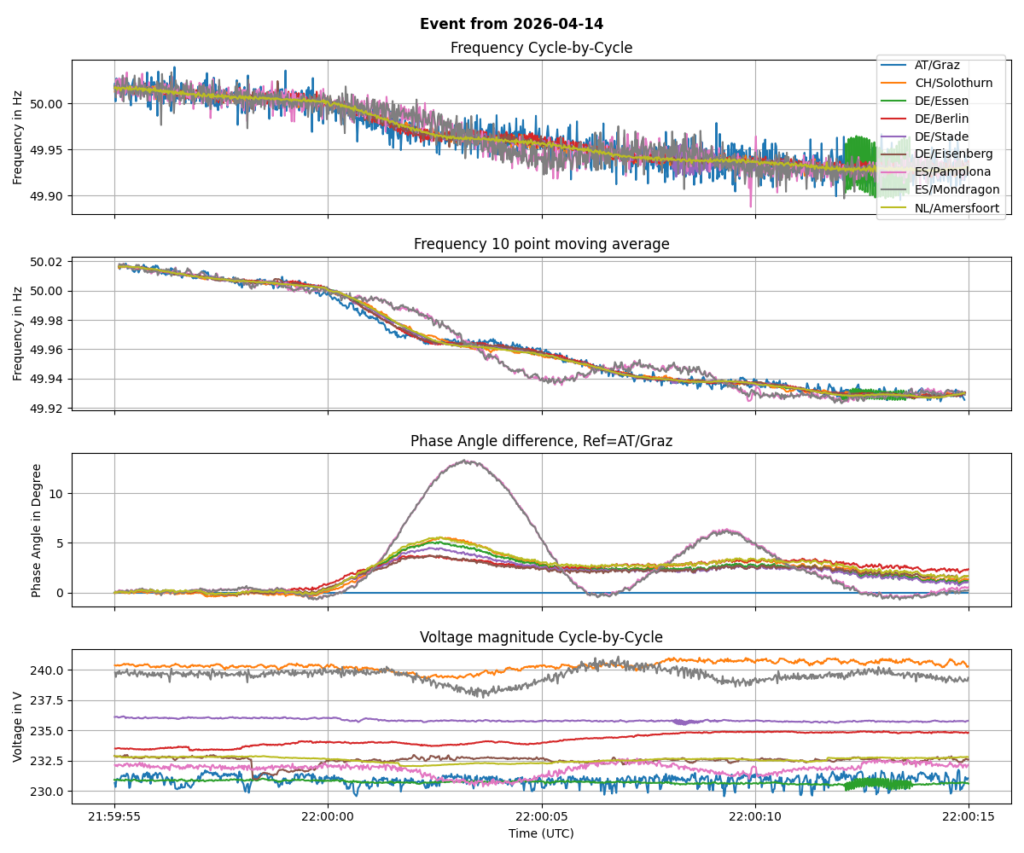
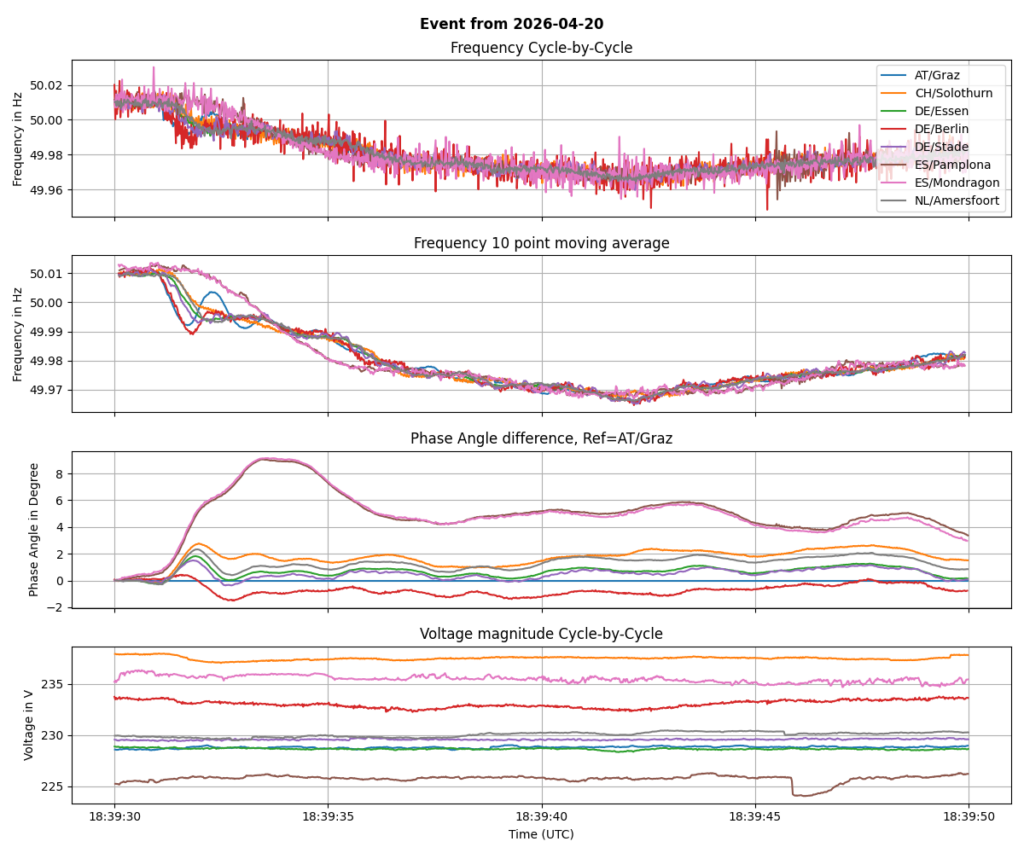
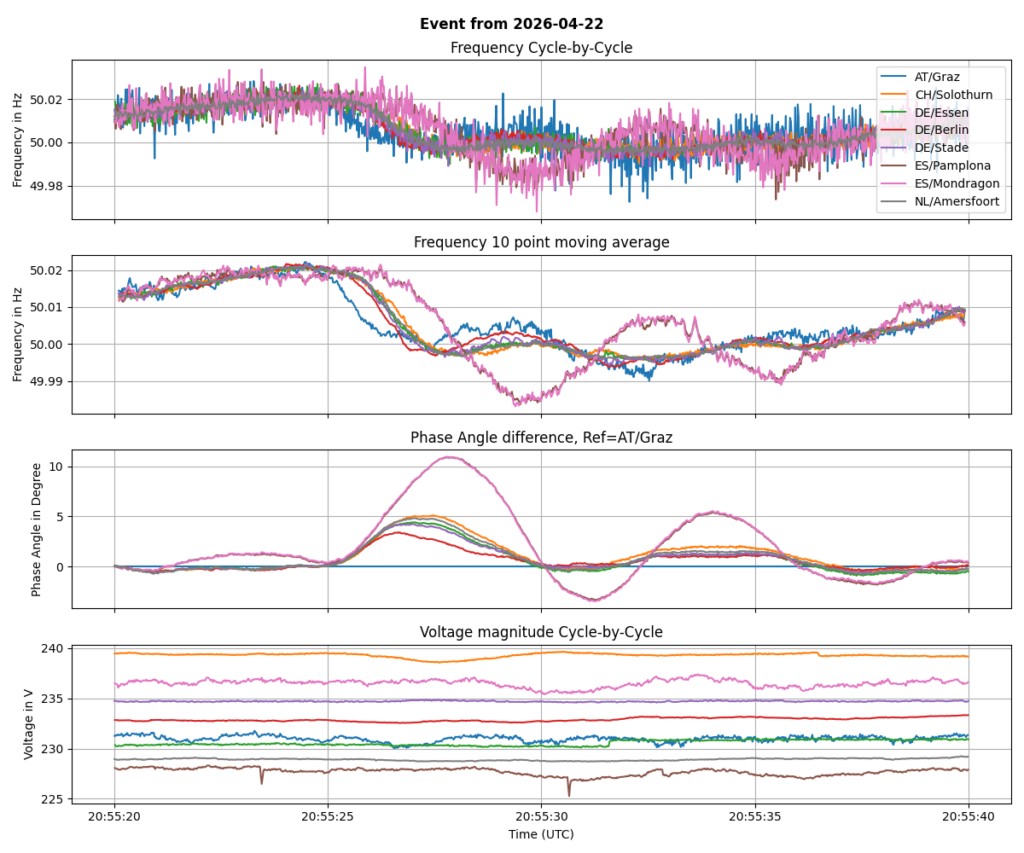
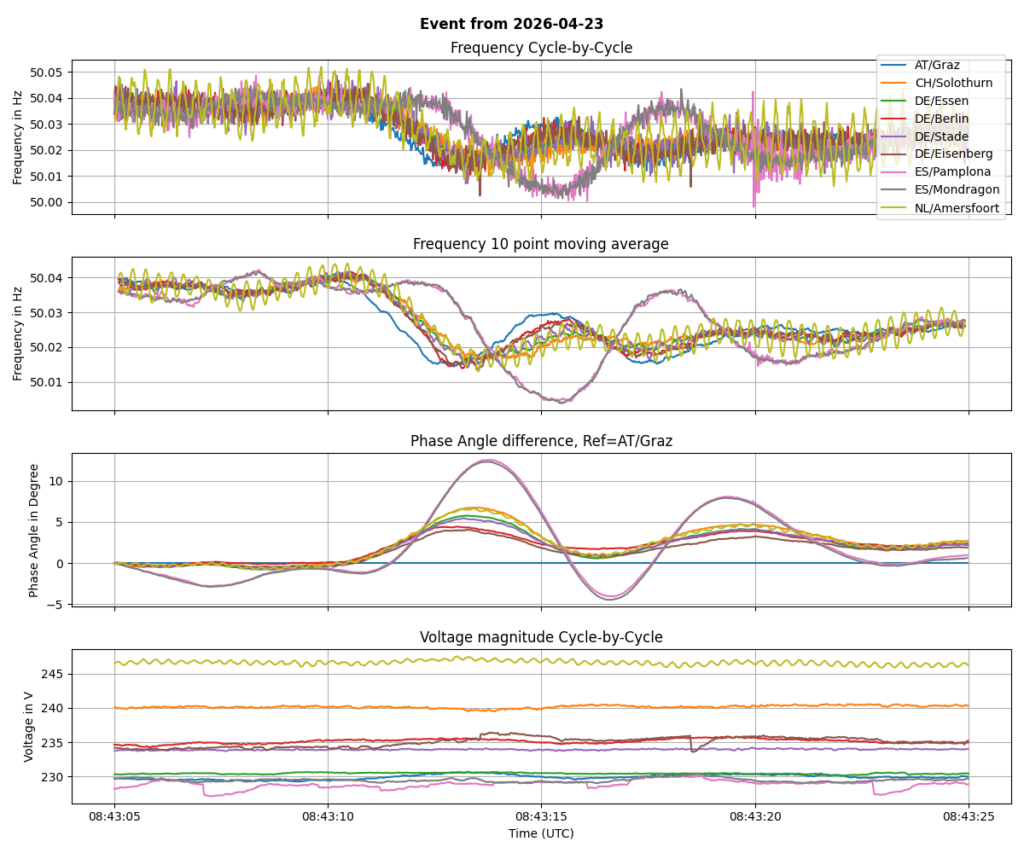
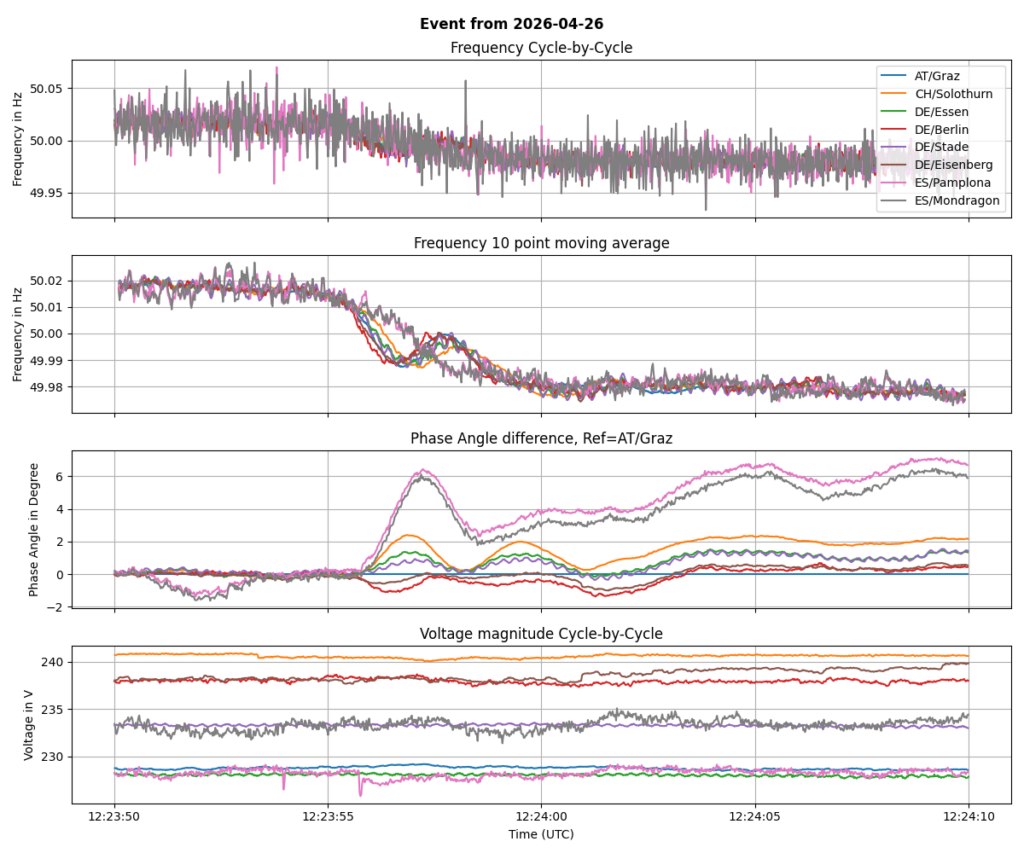
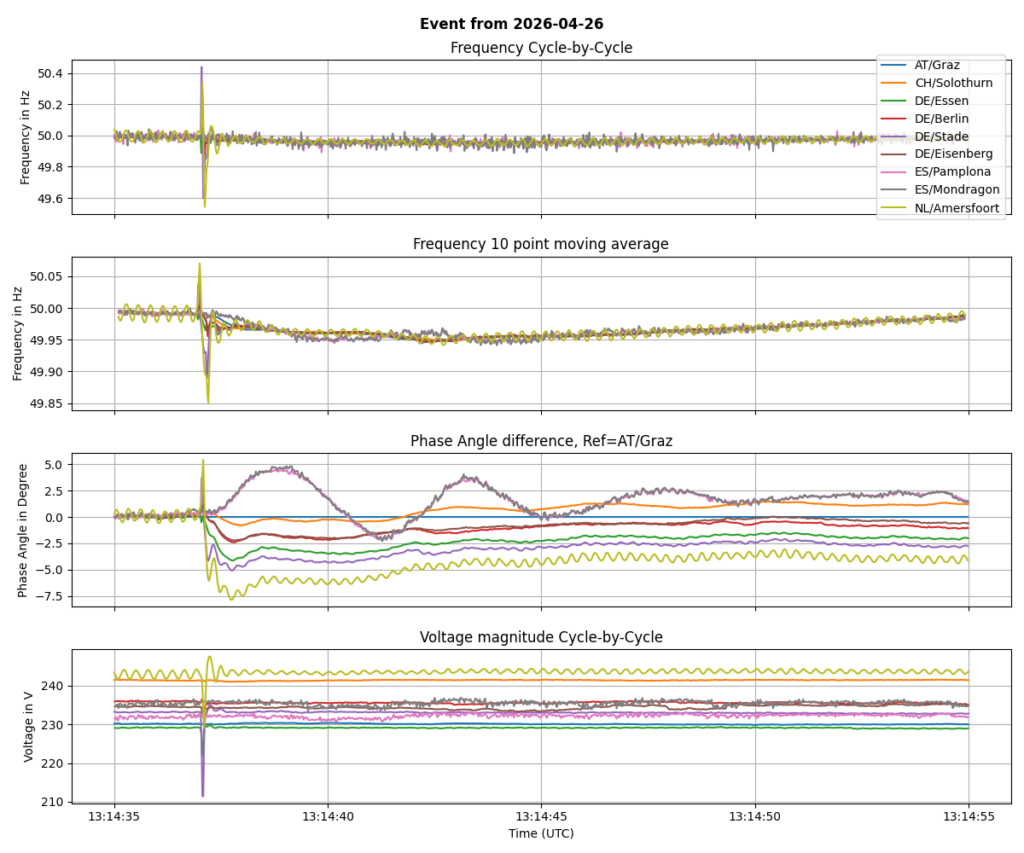
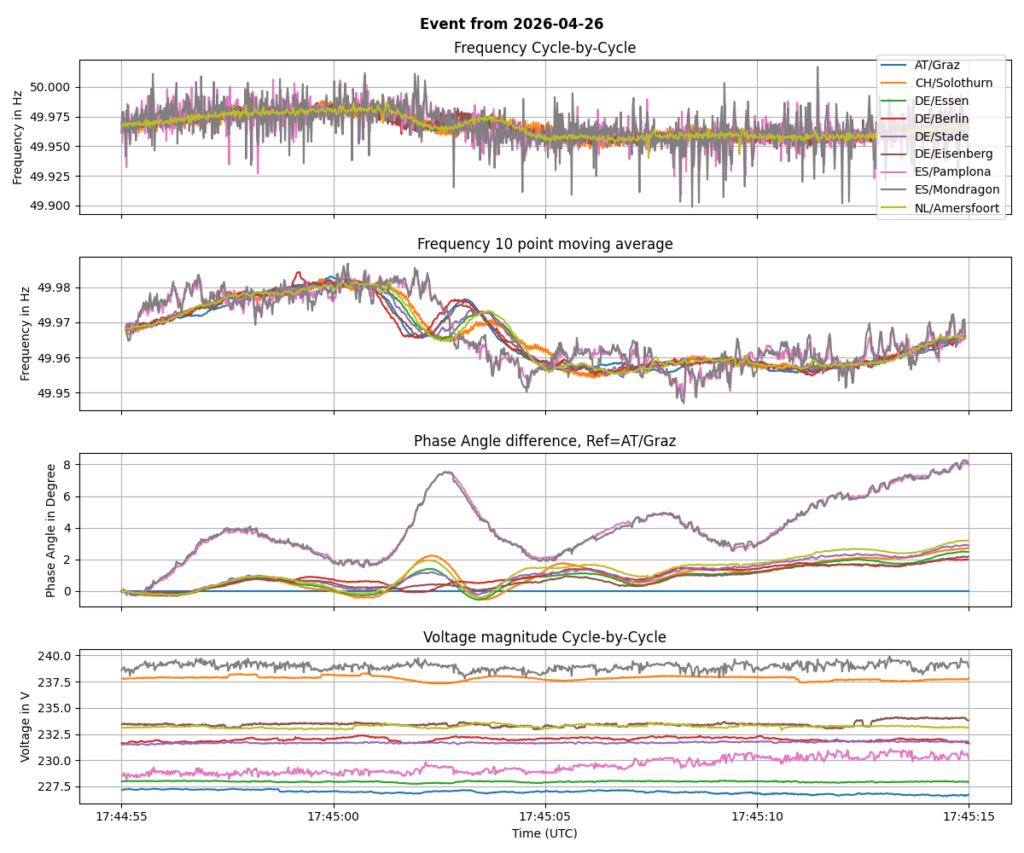
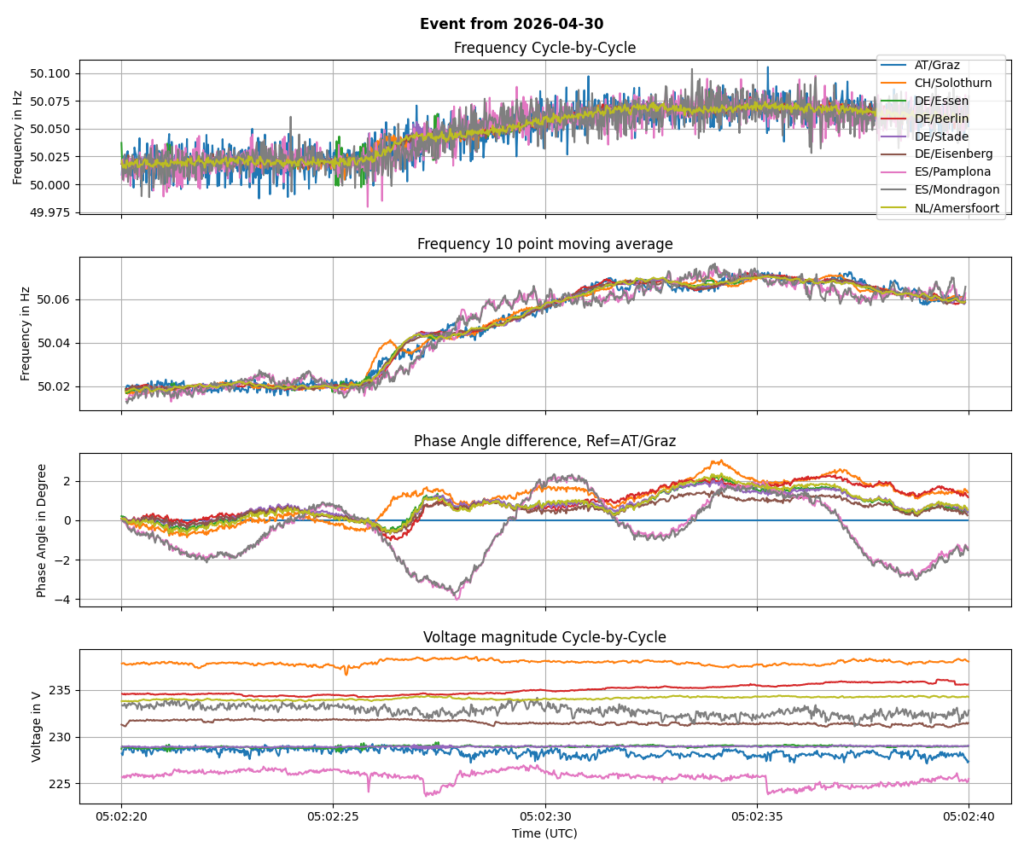
Events
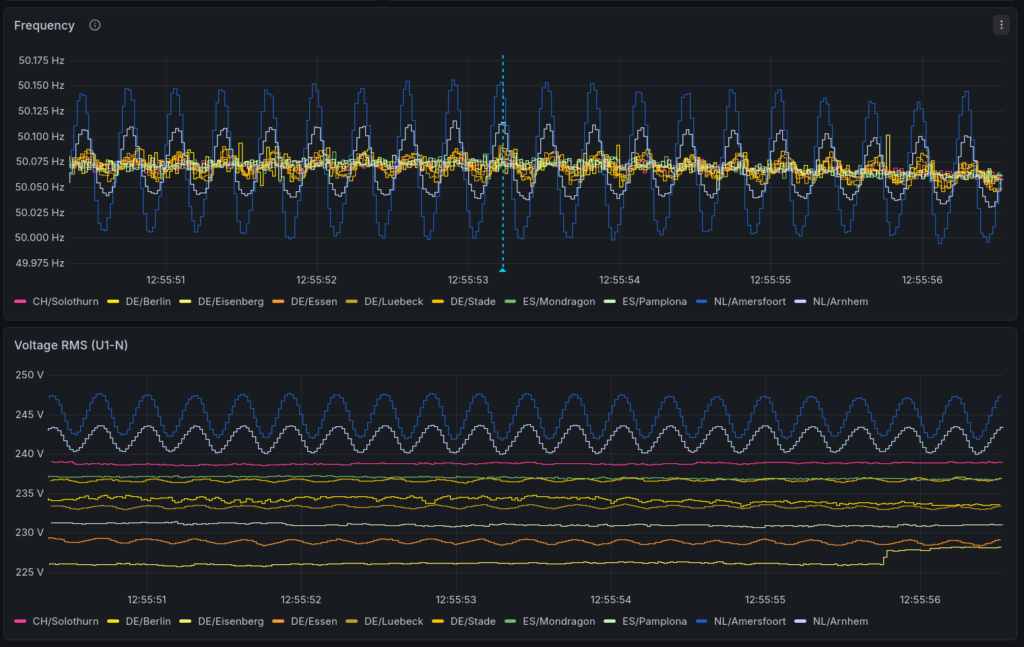
Below, there are several graphs, each representing a detailed time series plot of cycle-by-cycle frequency as well as 10-cycle moving average, phase angle difference and voltage magnitude.
Some readers had the idea of automatically analyzing these traces and doing some sort of „triangulation“ for estimating the area of event root. I had no time in february to give it a try, but it is on my list. If someone of you is interested of trying this, please use the archived data or the API for more recent events.
Thanks again for reading the whole report!
Yours, Michael