Why waveform data reveals what aggregation hides
In power system measurement and analysis, the method you choose for data acquisition is an important factor – especially when you’re chasing a phenomenon you don’t yet understand.
Because of the ongoing oscillation phenomena in the Netherlands, I intensified my work there, supporting locals with measurement equipment through PQopen to get system insights quickly and without complication. These oscillations (~3.5 Hz) can only be observed and quantified with devices that report at an output rate above 10 Hz – anything slower simply averages them away. The working assumption is that they are forced by residential PV inverters. To test this, we also monitor two inverters with PQopen, but the Dissipative Energy Flow (DEF) estimation showed no sign that these units were contributing.
A new opportunity then came up at a different site with an unusual setup: 32 microinverters – an interesting constellation to measure. Right after commissioning the PQopen, the data looked implausible at first glance: the current was fluctuating heavily. In the live PQopen dashboard the highest available resolution is one cycle (20 ms), and even at that resolution the graph was a mess.
So I enabled Point-on-Wave storage and visualized the raw waveform for a closer look. Point-on-Wave (PoW) means storing the actual sampled waveform – the shape of the signal itself – instead of the aggregated values most instruments report. And one thing became clear immediately: this was not a measurement or calculation error. The current waveform genuinely showed a strongly fluctuating magnitude, changing almost every cycle.
This reminded me again why PoW data is so valuable: it confirms or denies issues you can only suspect from aggregated data.
And here’s the uncomfortable part – with standard equipment, this phenomenon would typically go completely unnoticed. Let’s walk through it, one level at a time:
Power analysis, 1 s aggregation (typical meter)
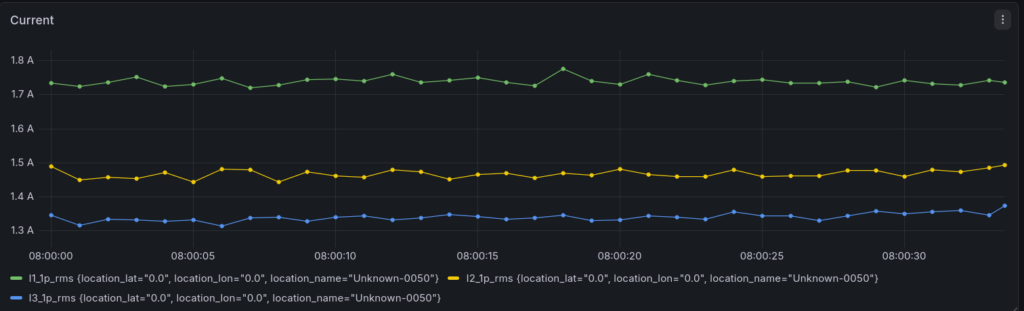
PQ analysis, 10 min aggregation
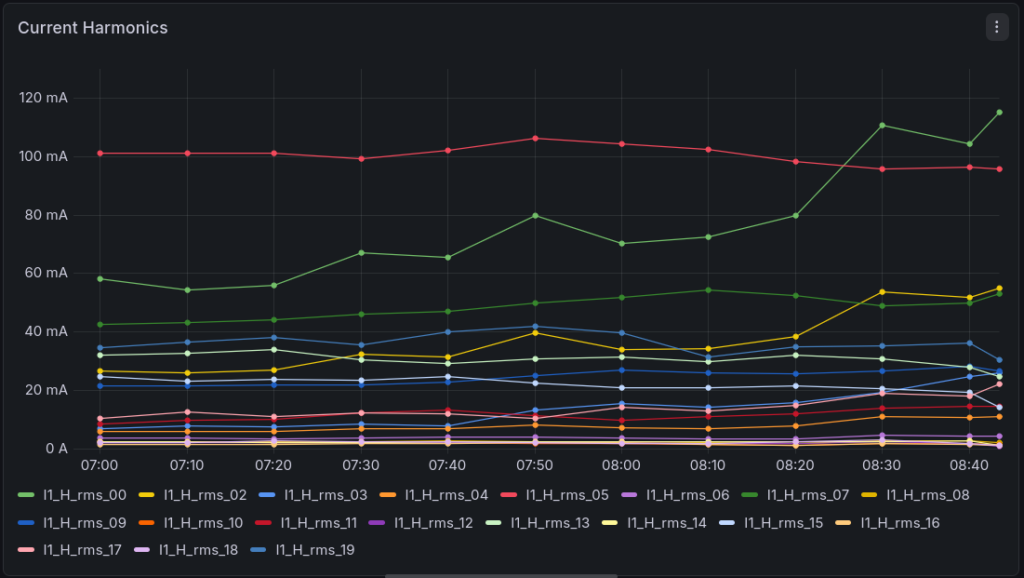
PQ analysis, interharmonics on the current inputs
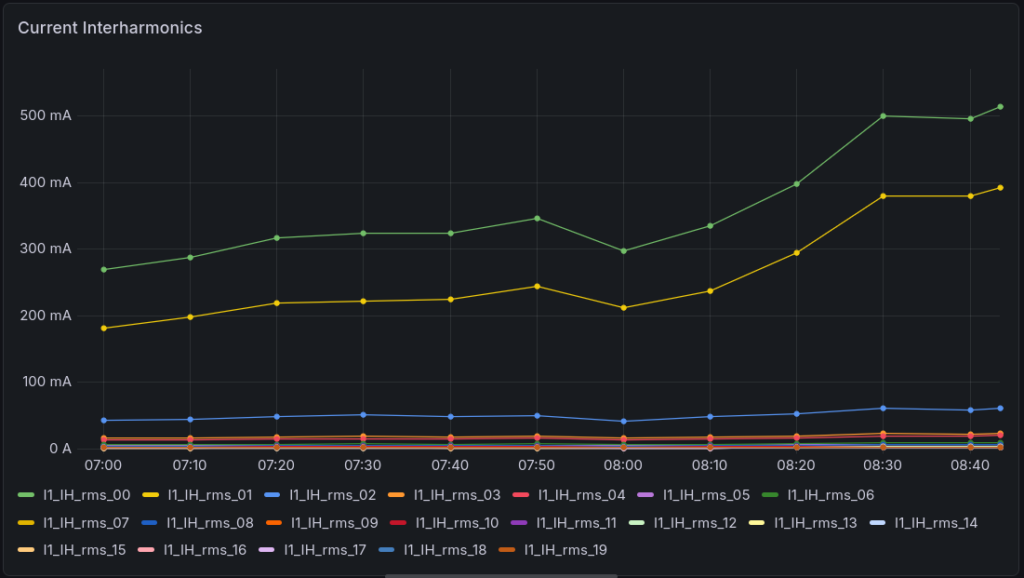
Power analysis, cycle-by-cycle
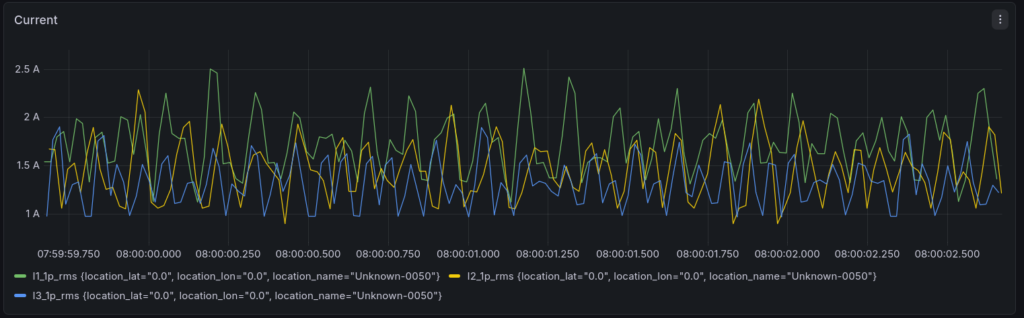
Point-on-Wave measurement
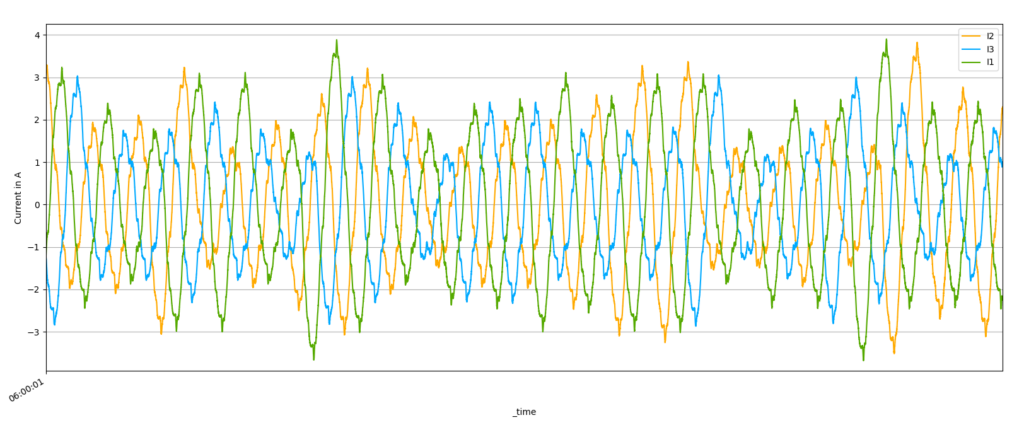
At the waveform level you can see the current changing amplitude very fast – possibly an interaction between the inverters‘ MPP trackers under low-light conditions. Whatever the exact cause, it does not look healthy for the grid.
Finally the lesson
Aggregation is efficient, but it hides. The deeper you look into the data, the more the truth emerges – and only Point-on-Wave shows the whole story. That is the real power behind Point-on-Wave acquisition.
Yours,
Michael