Welcome to the 5th report this year of the data acquired with the PQopen measurement network.
News of PQopen Network
Netherlands – more insights
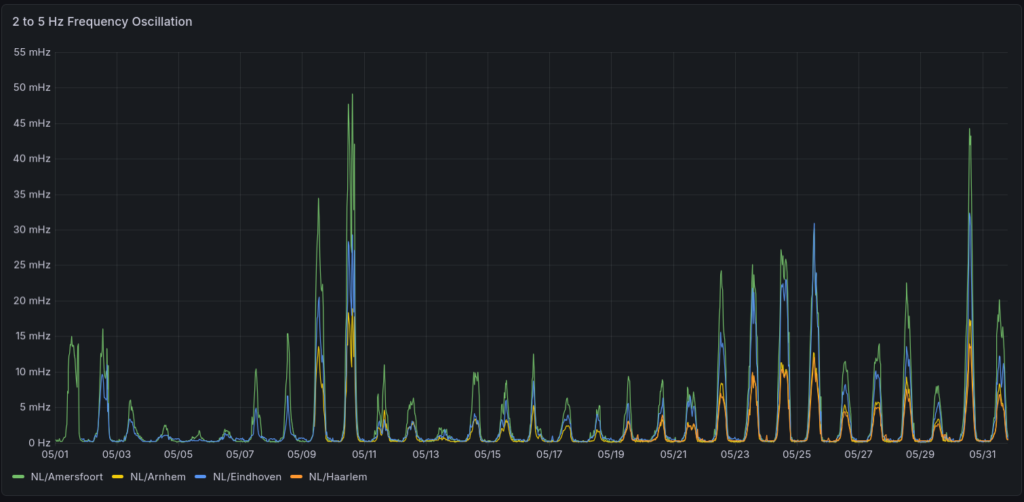
Due to the good response of my recent reports in the Netherlands, I intensified the work there. Now, four measurement locations in different areas (Amersfoort, Arnhem, Eindhoven and Haarlem) are active. An additional one is in preparation for Groningen to cover also the northern part of the country. The main goal is to get more knowledge regarding the 3.5 Hz oscillations there. I’m happy to work together on this with local grid operators and Universities.
ENTSO-E Nordic
Thanks to Beckhoff Automation (especially to Nils Johannsen), PQopen has an additional data source for Cycle-by-Cycle measurements of Voltage RMS and Frequency from different locations, including the Nordic Power System:
- Helsinki in Finnland
- Malmö in Sweden
Additionally, the following measurement locations in Central Europe are also operated by Beckhoff Automation:
AT/Vienna and DE/Luebeck. More to come!
Summary
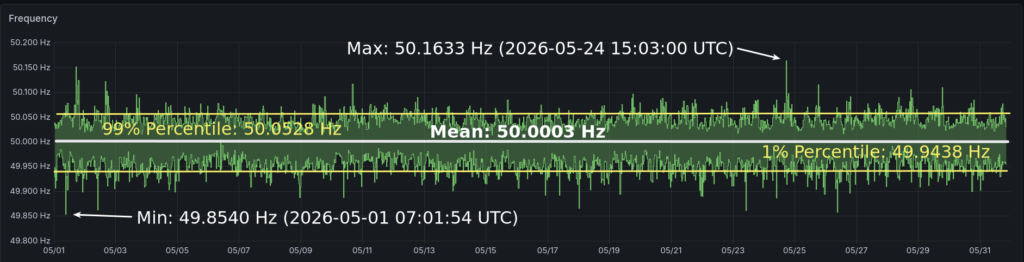
In the summary, the 1s-mean value of the mains frequency is evaluated.
| Statistics | Value and occurance |
|---|---|
| MIN | 49.8540 Hz (2026-05-01 09:01:54 CET) |
| 1% Percentile | 49.9438 Hz |
| MEAN | 50.0003 Hz |
| 99% Percentile | 50.0528 Hz |
| MAX | 50.1633 Hz in DE/Berlin (2026-05-24 17:03:00 CET) |
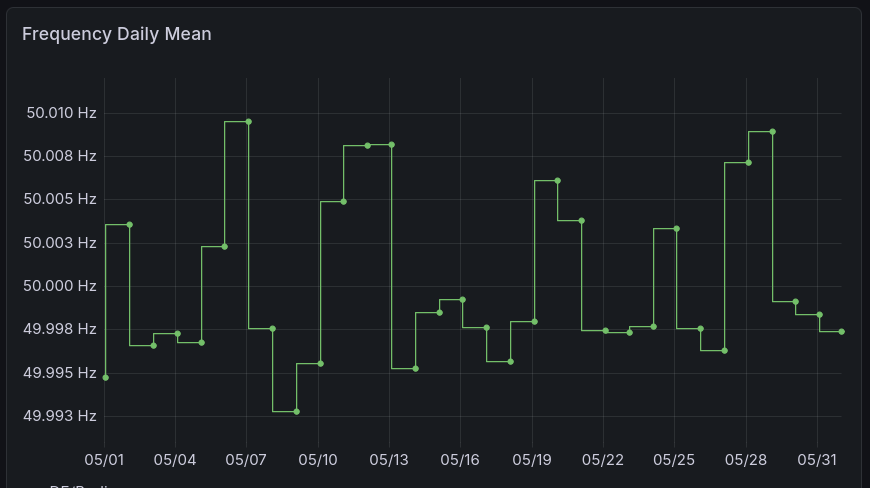
Daily Mean
The daily mean can give you an overview of the „accuracy“ of the grid control and their effect on grid synchronized clocks. April was very dynamic in this case, especially at the beginning of the month.
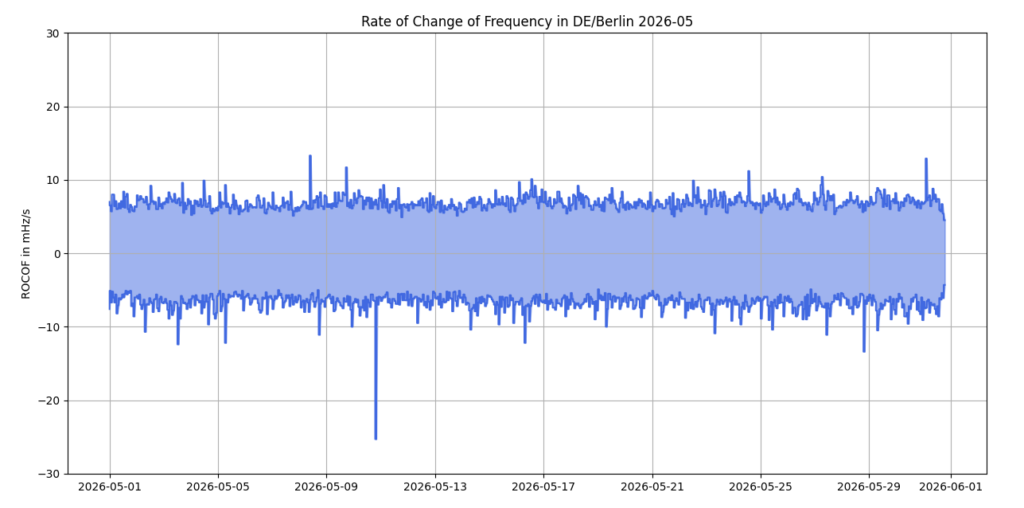
Rate of Change of Frequency (ROCOF)
The ROCOF is an indicator for potential events and the steadiness of the frequency. The higher the value, the more disturbances are at work (oscillations, transients…).
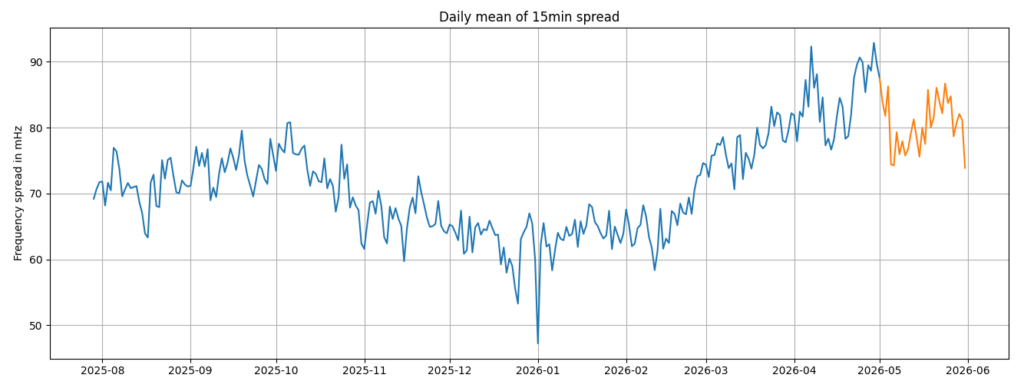
Frequency Spread
I introduced the metric „Frequency Spread“ in the posting, where I analysed the dynamic of the frequency the past 15 years. From now on, I want to use this metric in this report.
Inter-Area oscillations
The inter-area oscillations is a long-known phenomenon resulting from the wide area of interconnected countries. In Spain, two modes can be detected, the east-center-west and the east-west mode.
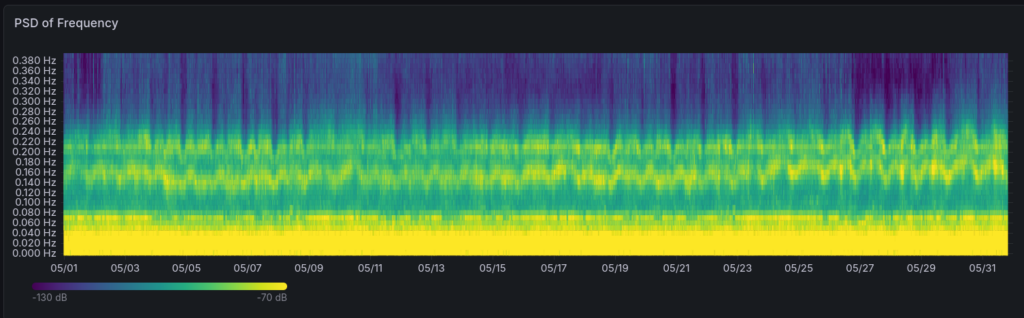
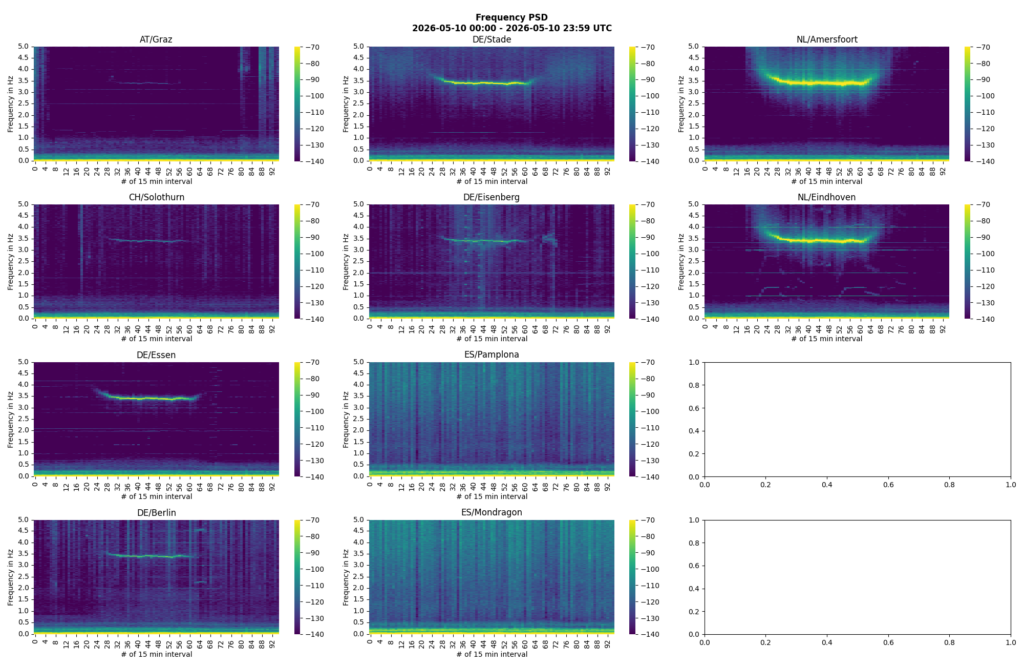
Oscillations in the Netherlands
Other Abnormalities
More deviations of frequency below 49.9 Hz and over 50.1 Hz, a fall of >50% can be noticed compared to previous month:
| ENTSO-E Central Europe | < 49.9 Hz | > 50.1 Hz |
|---|---|---|
| Count of threshold crossings | 42 (-41) | 30 (-42) |
| Number of seconds below/above | 1049 (-1030) | 684 (-1245) |
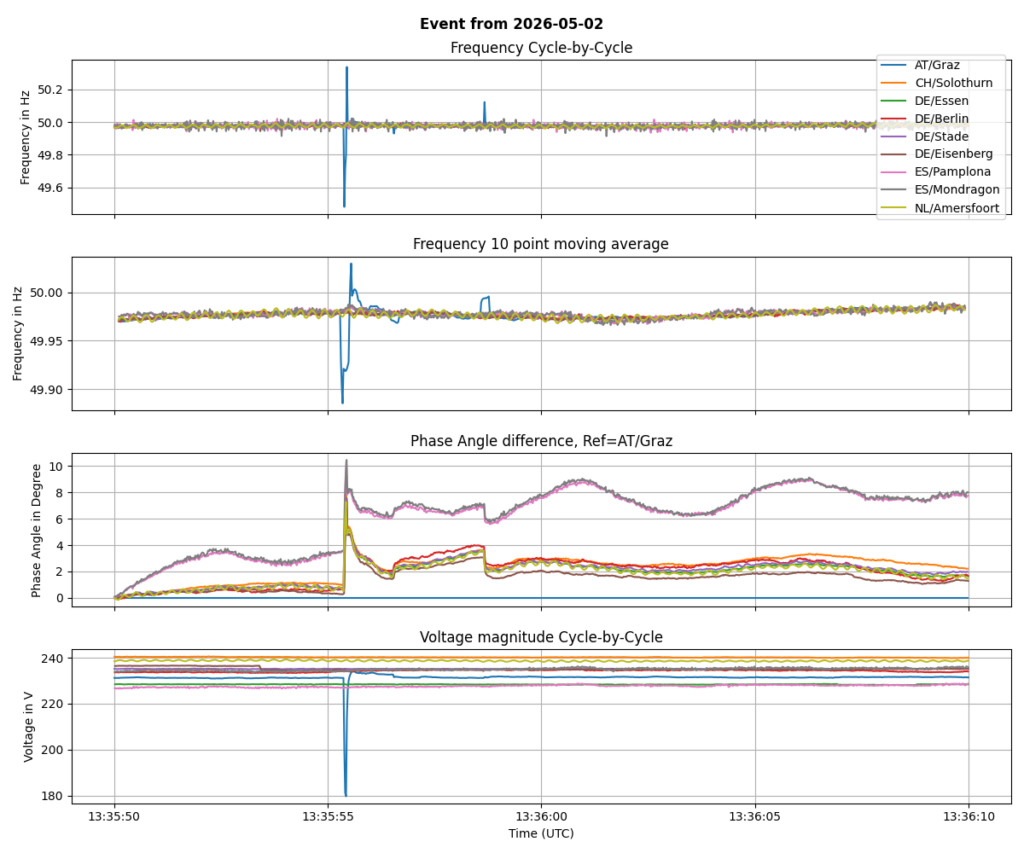
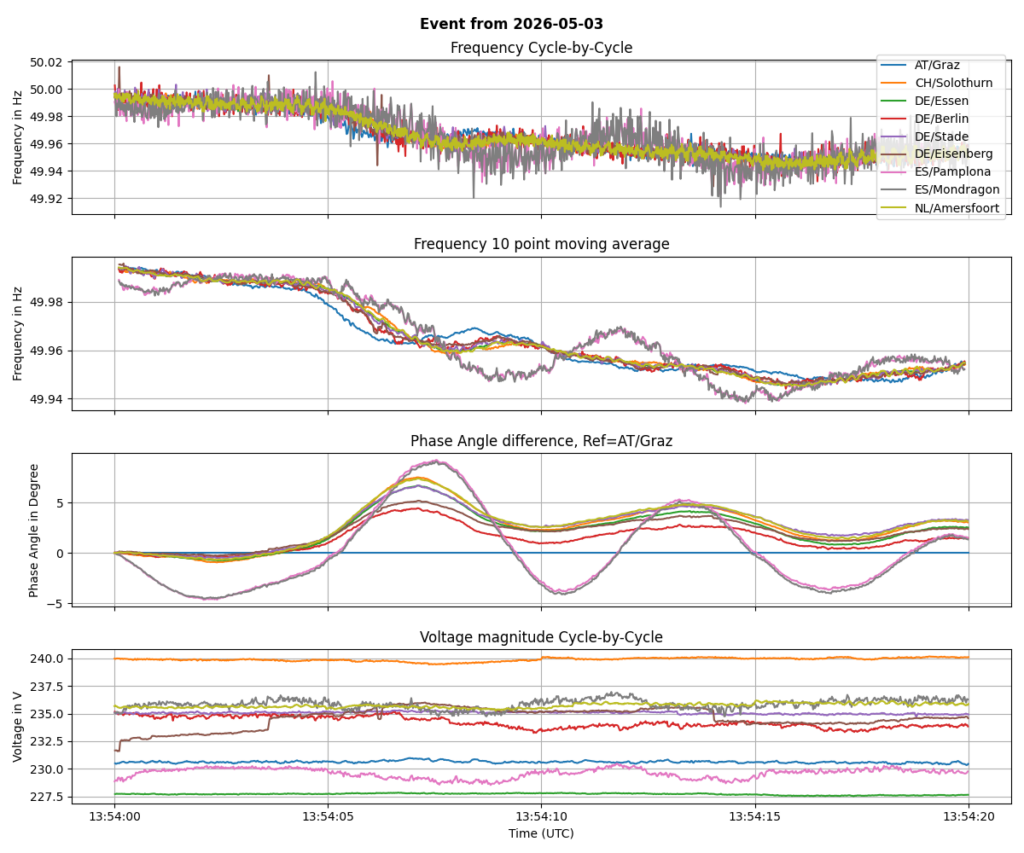
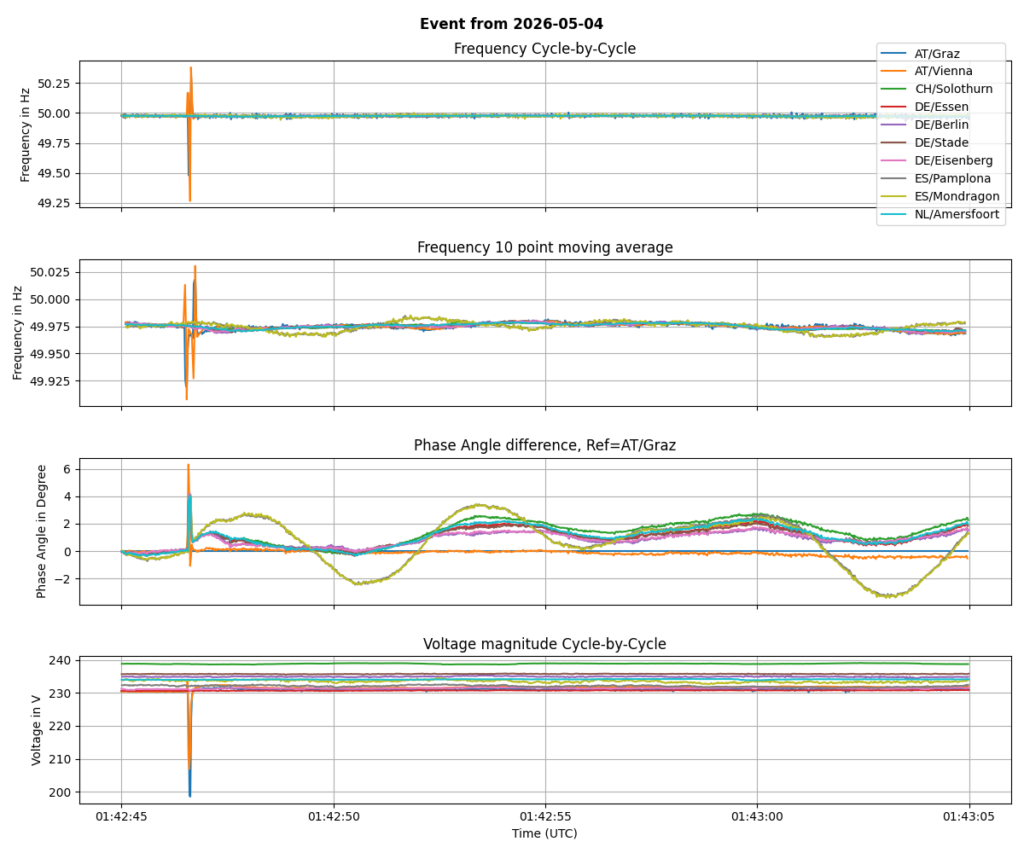
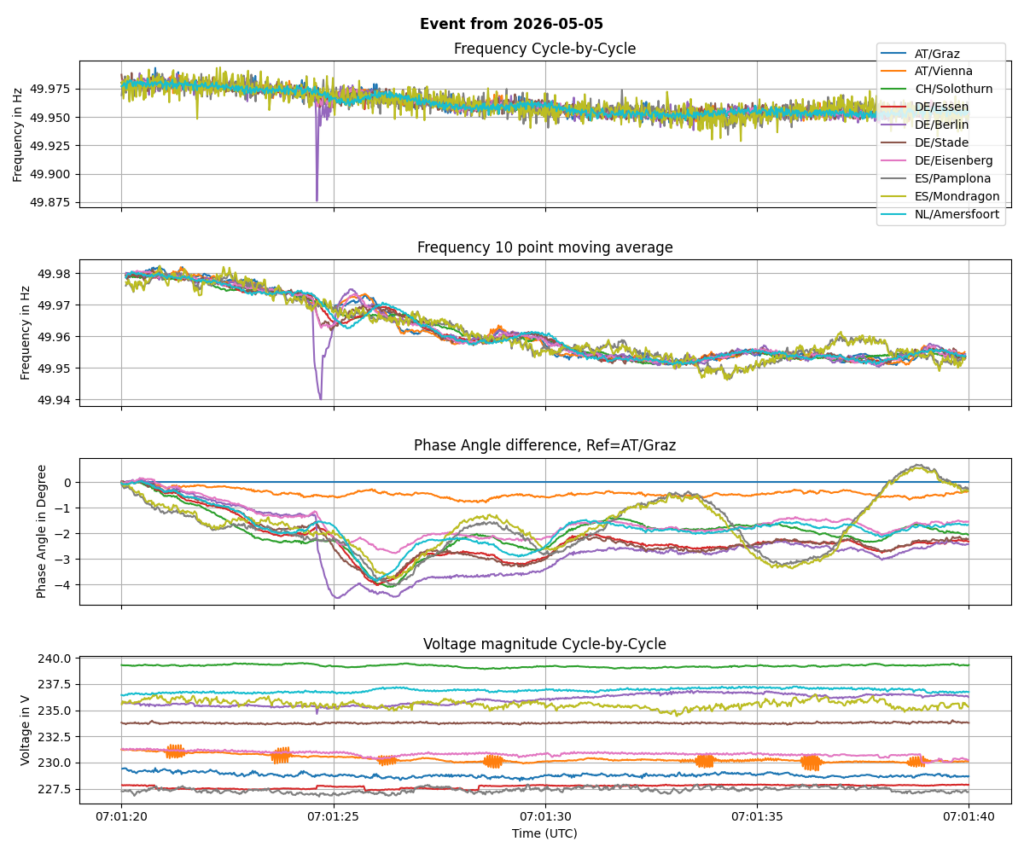
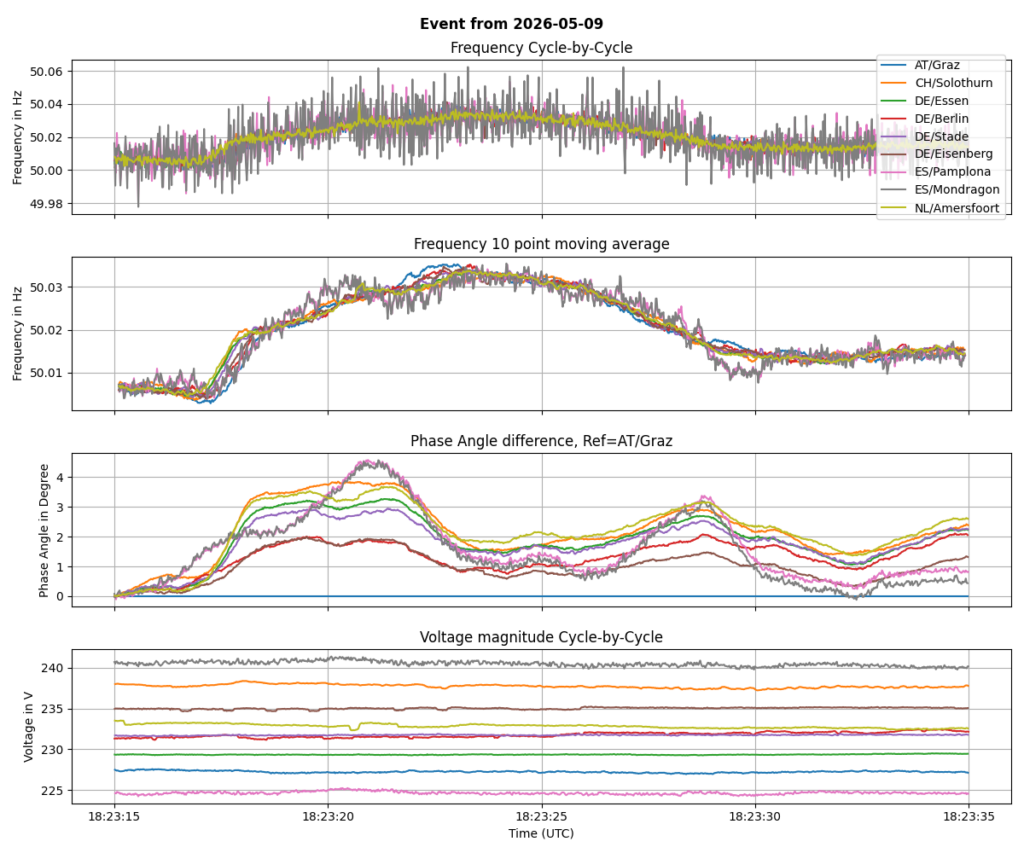
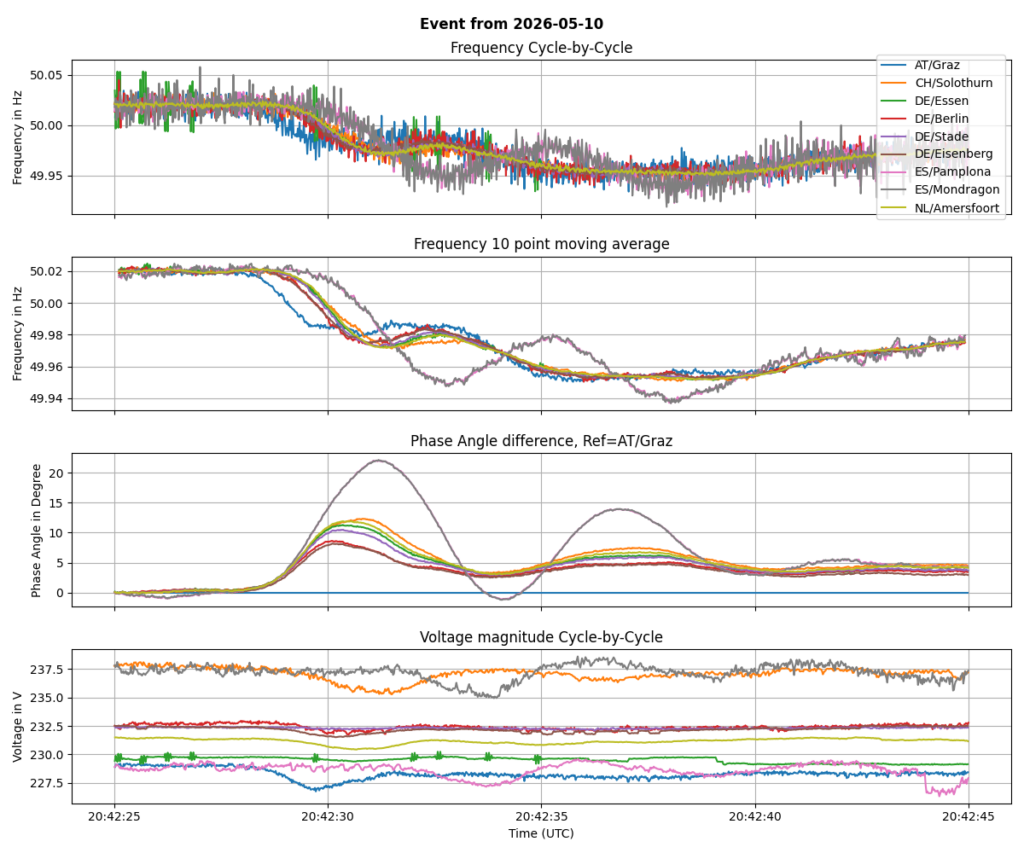
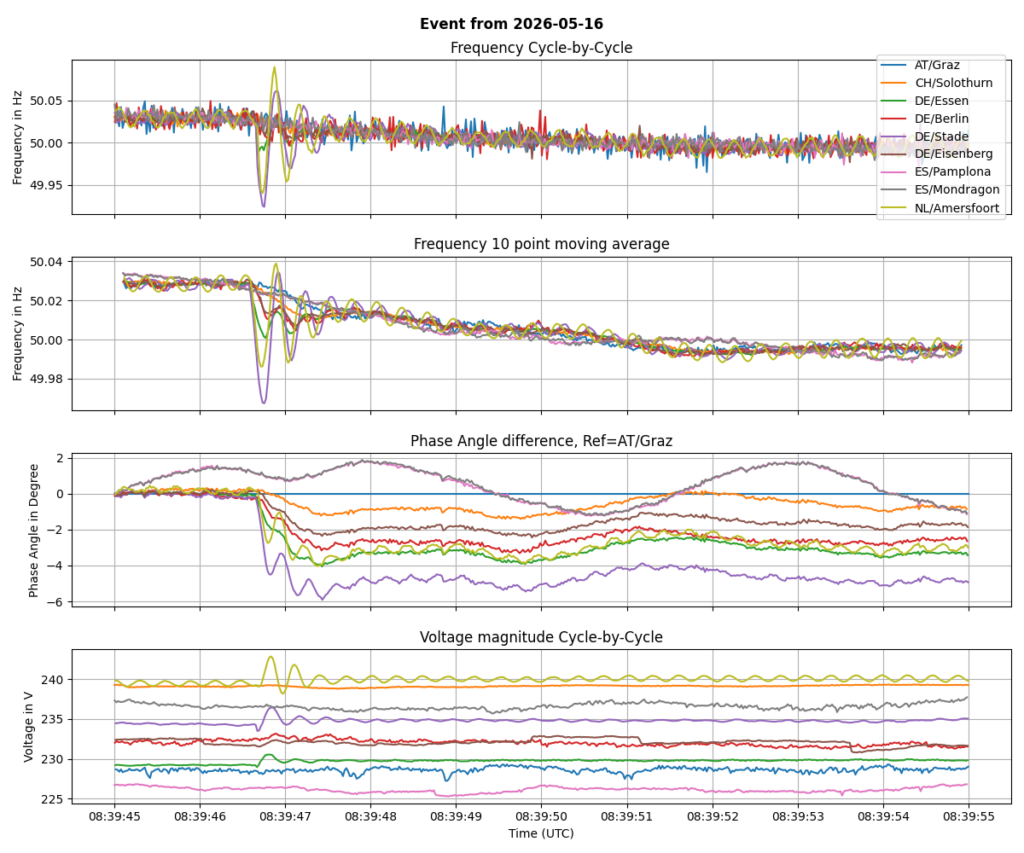
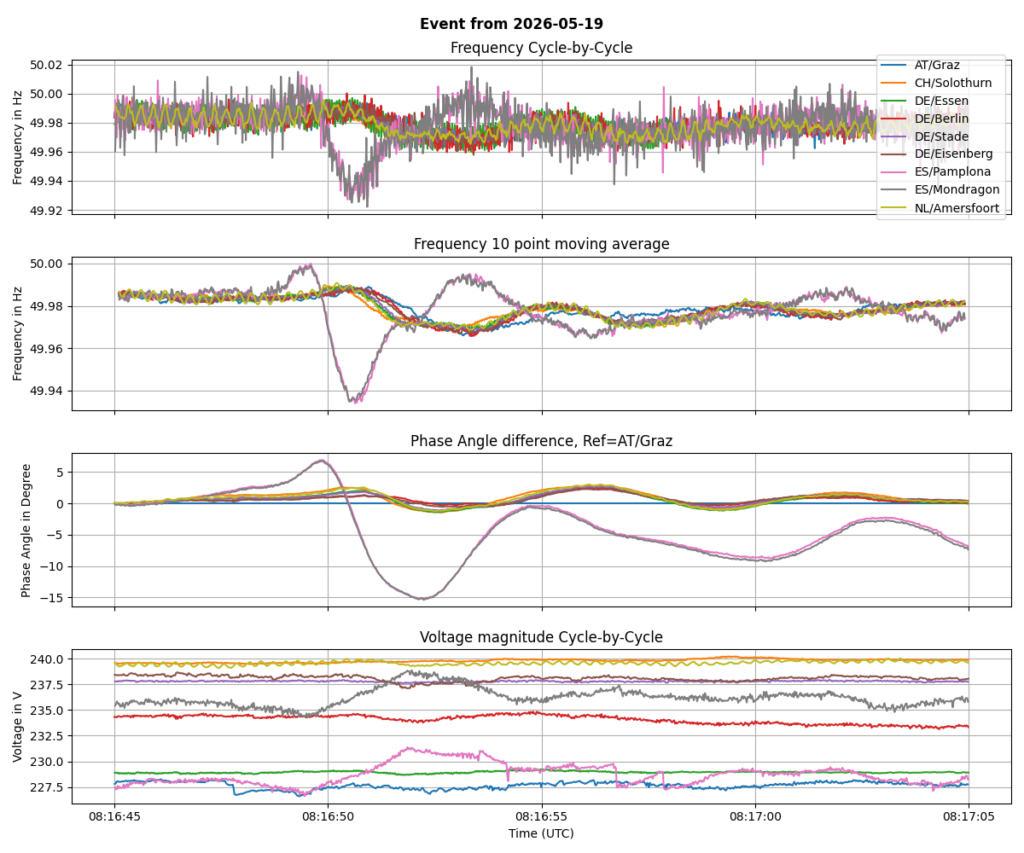
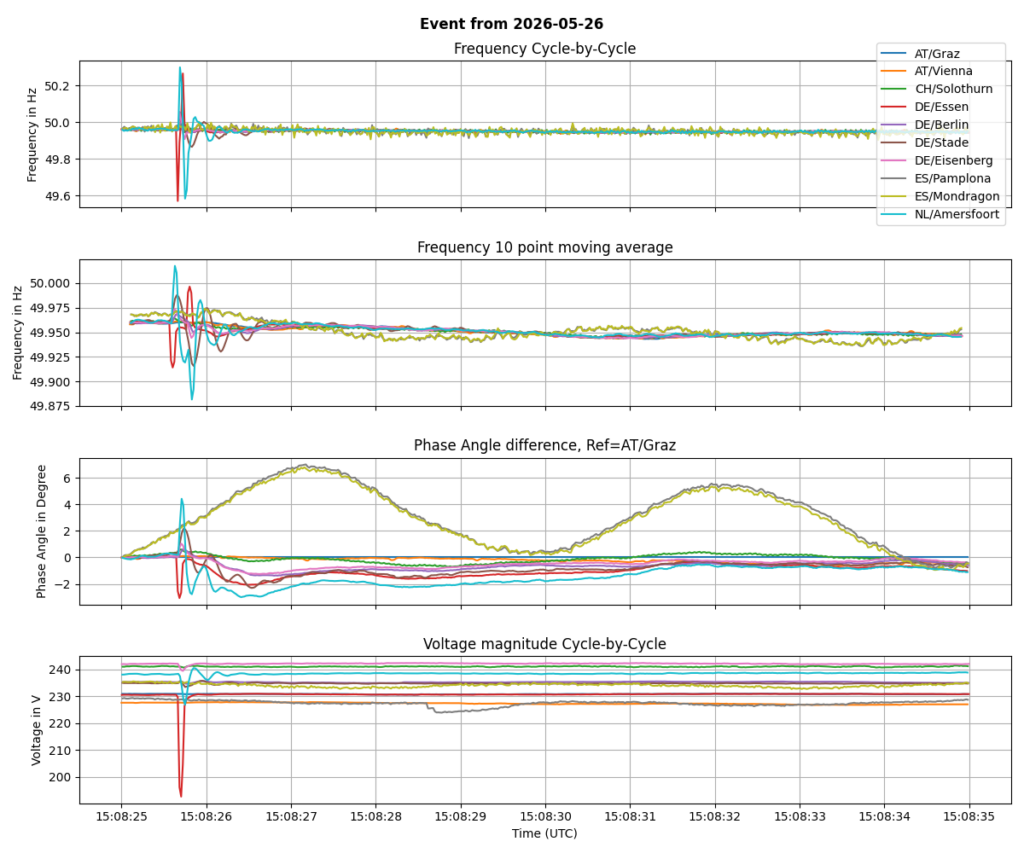
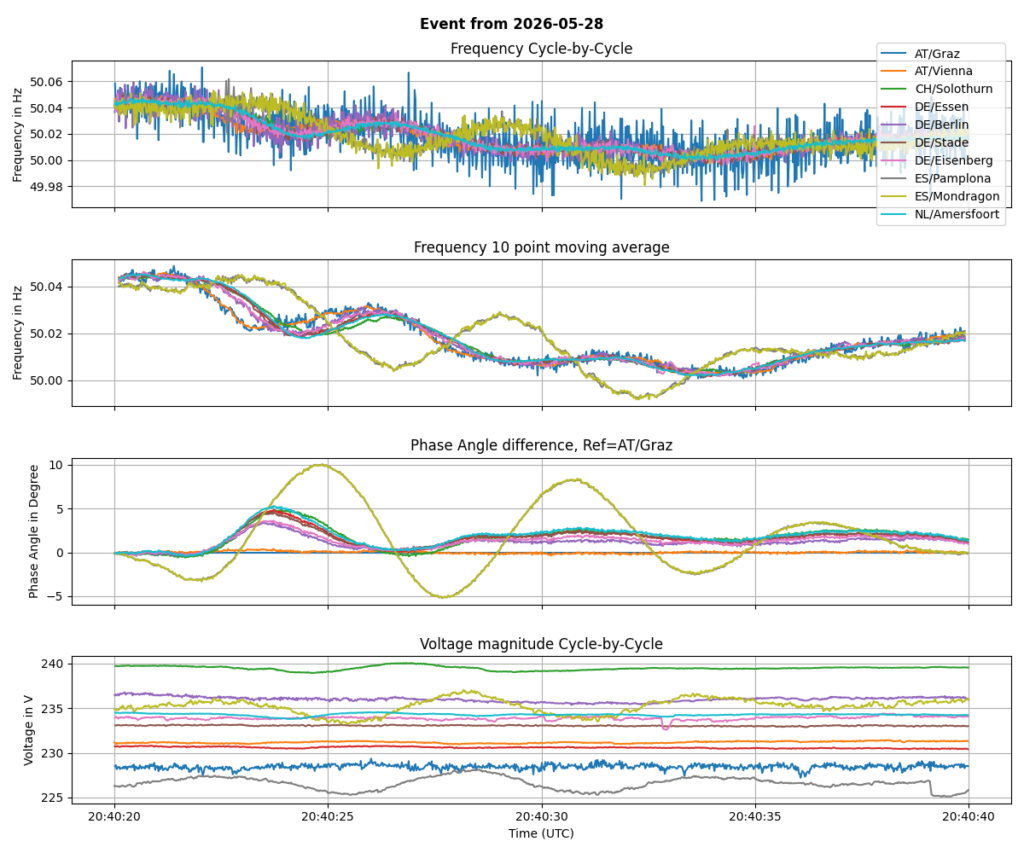
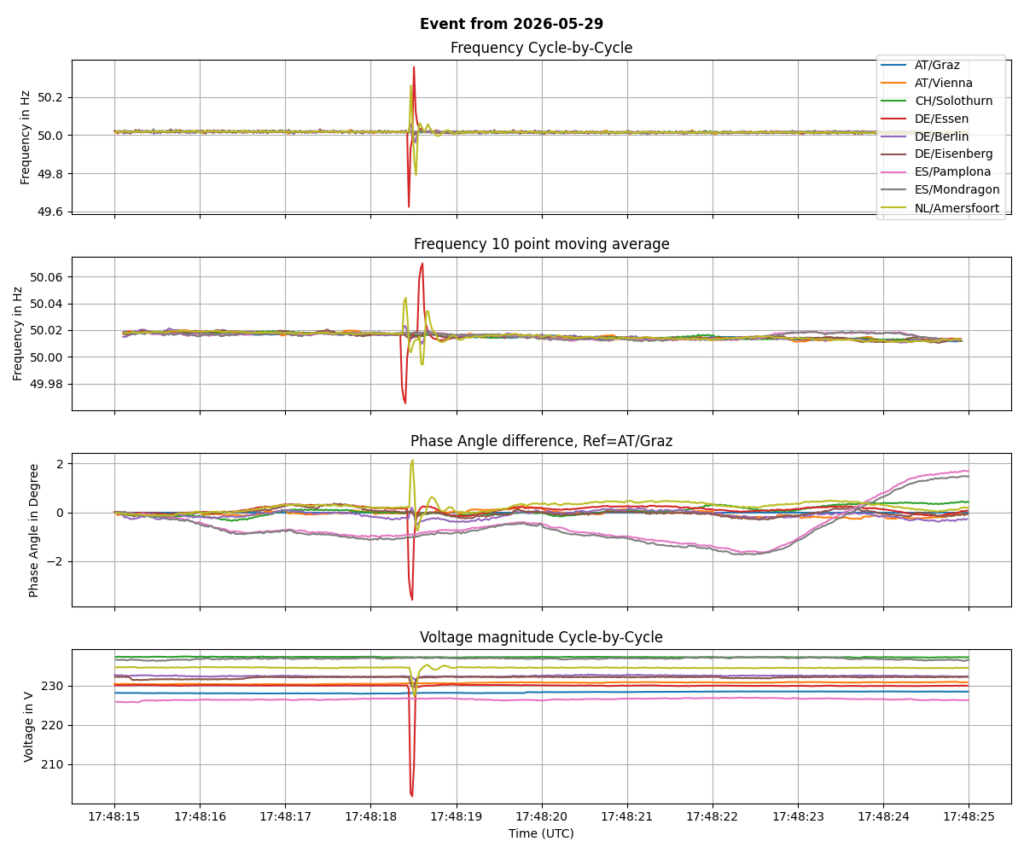
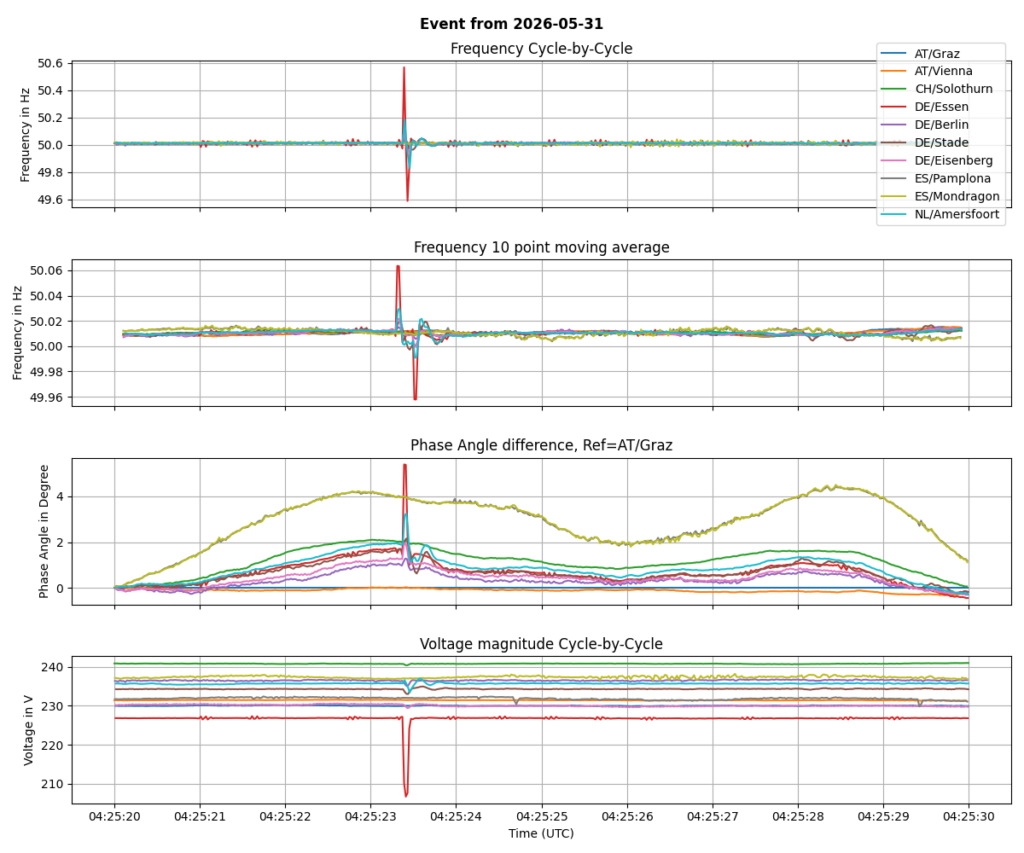
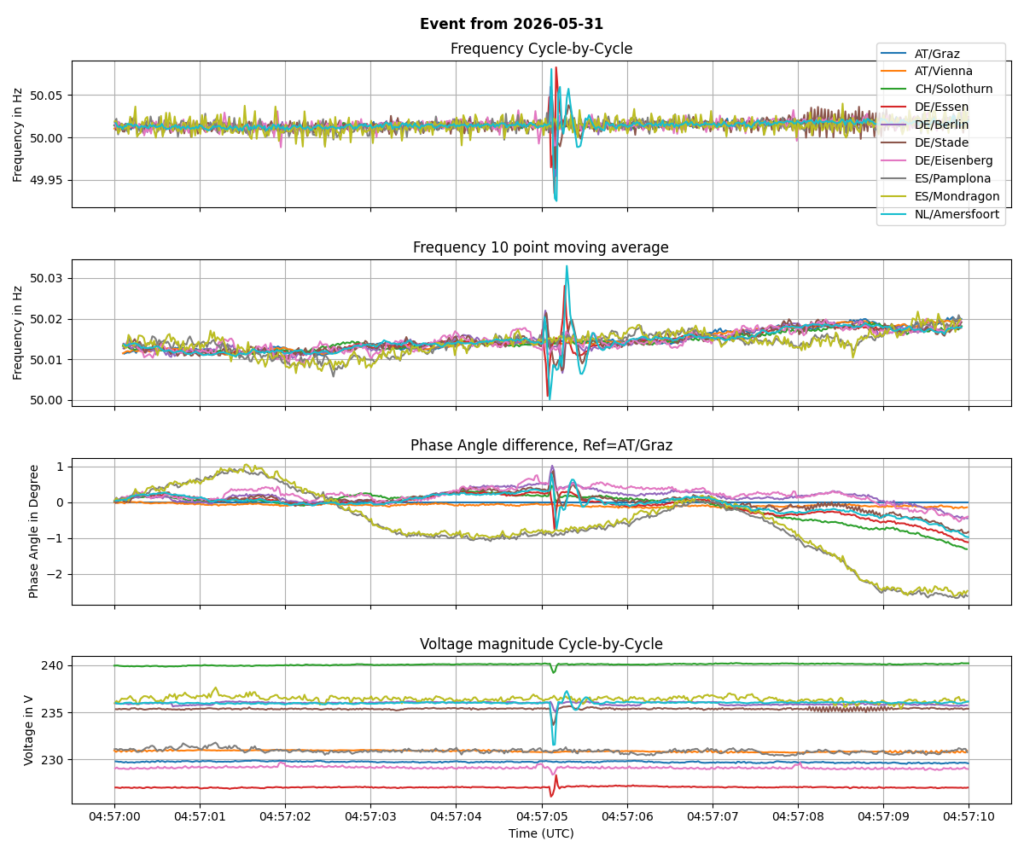
Events
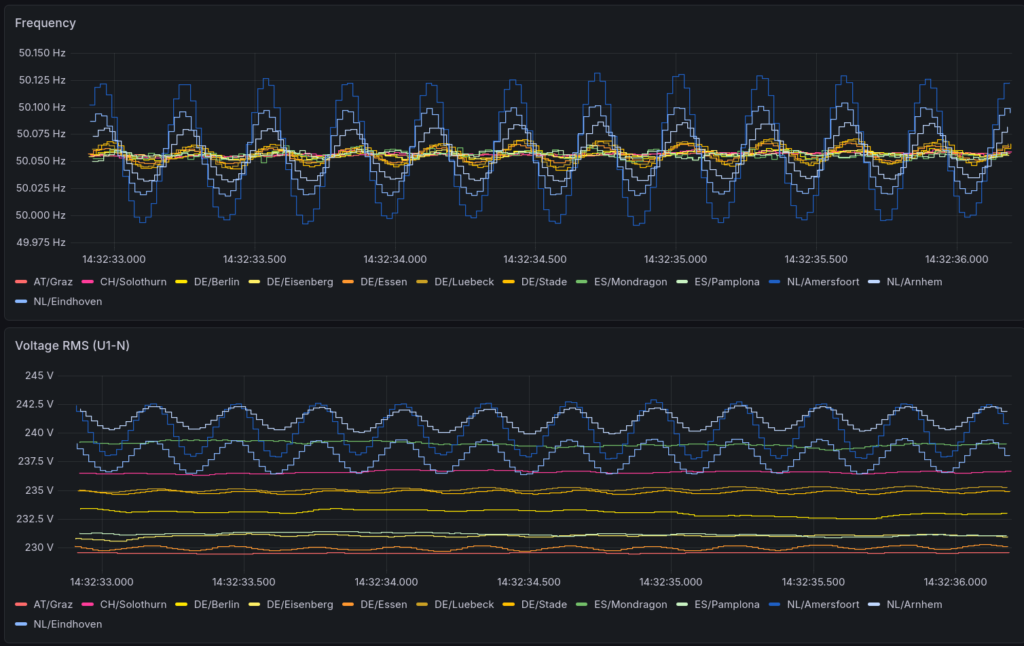
Below, there are several graphs, each representing a detailed time series plot of cycle-by-cycle frequency as well as 10-cycle moving average, phase angle difference and voltage magnitude.
Some readers had the idea of automatically analyzing these traces and doing some sort of „triangulation“ for estimating the area of event root. I had no time in february to give it a try, but it is on my list. If someone of you is interested of trying this, please use the archived data or the API for more recent events.
Yours,
Michael