I started the PQopen monitoring about a month ago with two measurement points for testing the infrastructure and data presentation. I described the system architecture in my last posting: PQopen – Open Data für das Stromnetz von morgen.
Now I want to summarize the state and experience of this period. First of all, I want to show some analysis of the measured grid frequency. In the second part, there are some numbers about the monitoring system itself.
Analysis of Grid Frequency
Statistical Data of 1s mean value
There are two data streams of every measurement point. One with cycle-by-cycle resolution and one with 1s aggregated values. The latter were activated a week later, so the resulting data shows only the last 21 days (=3 weeks).
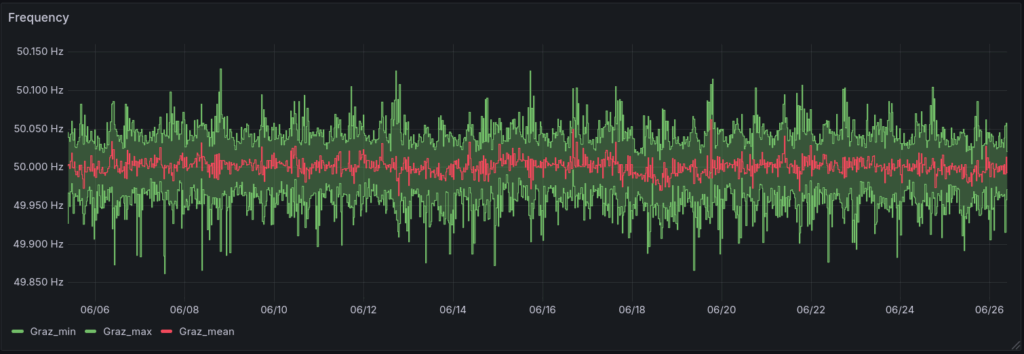
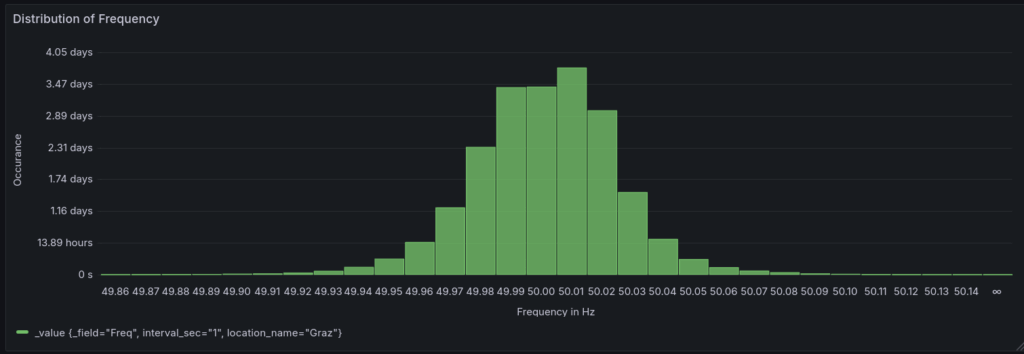
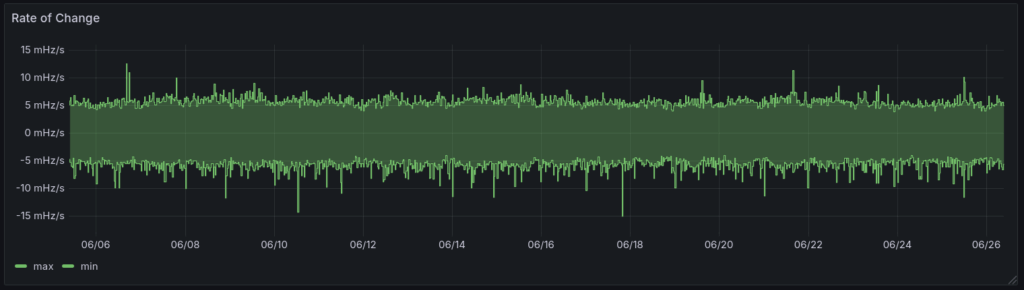
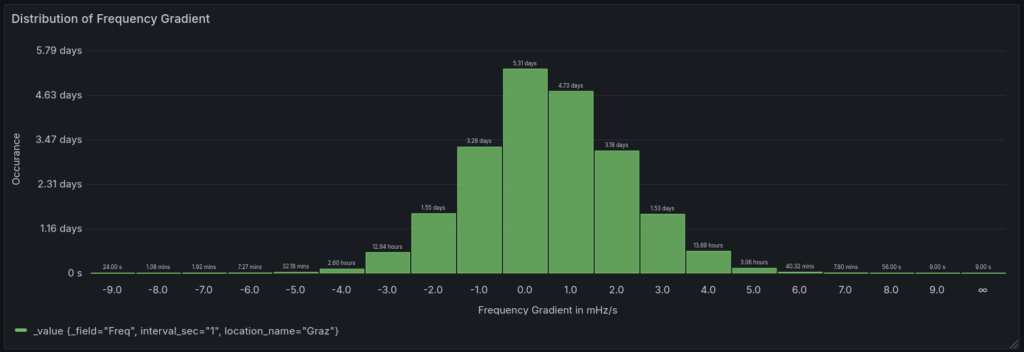
For detailed view, you can visit the dashboard panel: Frequency Statistics
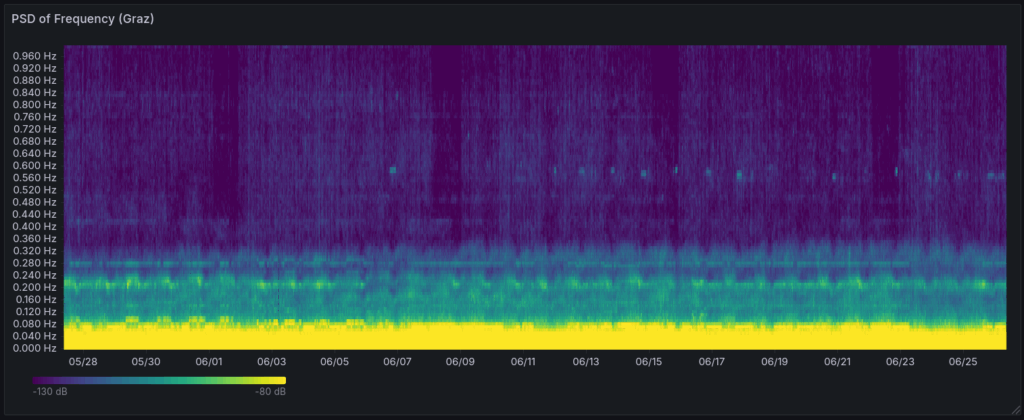
Power Spectral Density
Inspired by the publications and presentations from Leonhard Probst, I used the faster sampled frequency data for a PSD analysis to extract spectral patterns. The PSD is calculated every 15 minutes from cycle-by-cycle data and visualized in a heatmap.
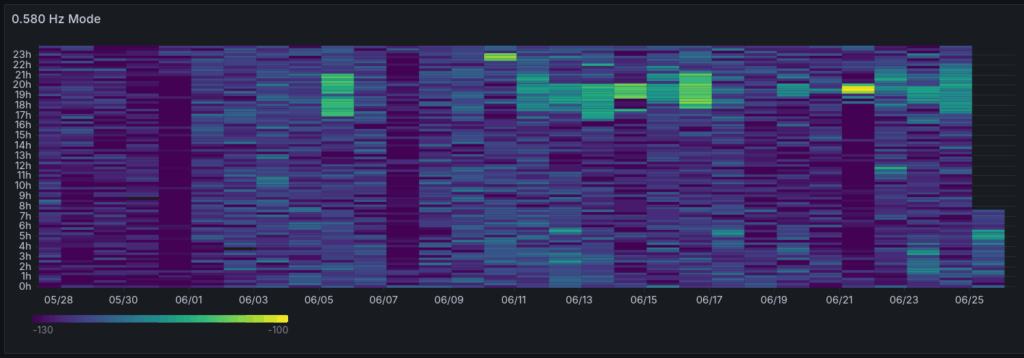
Detailed View of 0.58 Hz mode
This was a short analysis and showcase of the first month of the grid monitoring system. It will get much more interresting, when there are more measurement devices out there.
Monitoring System
After a month of operation, some metrics and background information may be interresting for some of you.
Server Metrics
| Metric | Value |
|---|---|
| Database Size | 5.7 GB |
| Average Load | 0.12 |
| Average Memory Use | 24% of 7.6 GB |
Background Calculation (PSD)
The PSD of the frequency is not calculated on the fly, but with a separate docker container executing the calculation every 15 minutes. This process reads the cycle-by-cycle data from the past 15 minutes, calculates one spectrum and writes the data back into the database for viewing in Grafana.
- Read 15 Minutes of cycle-by-cycle data (~45000 Samples)
- Calculate PSD with welch-method with 5000 samples window size (results in 10 mHz resolution)
- Write back the data into the database
Collected Measurement Data
For the monitoring and comparison between the measurement points, I selected a collection of channels which are transmitted and stored on the monitoring server:
| Channel Name | Description | Intervals |
|---|---|---|
| Freq | Mains Frequency in Hz | Cycle-by-Cycle, 1s |
| U1_1p_rms | RMS Voltage of L1 | Cycle-by-Cycle |
| U[i]_rms | RMS Voltage of L[i] | 1s |
| U[i]_THD | THD of Voltage L[i] | 1s |
| U[i]_pst | Pst (Flicker) of Voltage L[i] | 10min |
Outlook
The first remote measurement device is on its way to the operator, a second will be out for delivery in the next days. I’m looking forward to get them operational to start real distributed measurement.
Best regards, Michael