Since the launch of PQopen, I am frequently asked: How can a phenomenon discovered in a local low-voltage (LV) grid be classified as a cross-regional event?
In this article, I will demonstrate that for specific events and parameters, local measurements provide excellent evidence of what is happening across the wider synchronous area.
Frequency: The „Heartbeat“ of the Grid
In a broad sense, the mains frequency is identical across an entire synchronized area (e.g., Continental Europe). If you measure the frequency at a power outlet in Spain, it will mirror a measurement taken in Austria.
However, this „identity“ depends on your observation window:
- Steady State: Using a standard 10-second average (typical for most Power Quality Analyzers), you will see no difference between locations.
- Grid Dynamics: If you decrease the observation period, the real dynamics of the grid emerge. You will notice the readings begin to diverge because the local voltage phasor differs slightly between locations. The grid is never truly in a steady state; frequency is constantly fluctuating due to the balance of load and generation.
Because of this, most frequency changes are detectable everywhere, though they appear differently in the time domain:
- Generation Losses: These trigger an immediate frequency drop across the entire system, though with varying propagation delays.
- Switching Operations: These create distinct shapes and directions of change due to immediate shifts in power flow.
- Low-Frequency Oscillations (< 5 Hz): These can be detected system-wide, depending on their magnitude and origin.
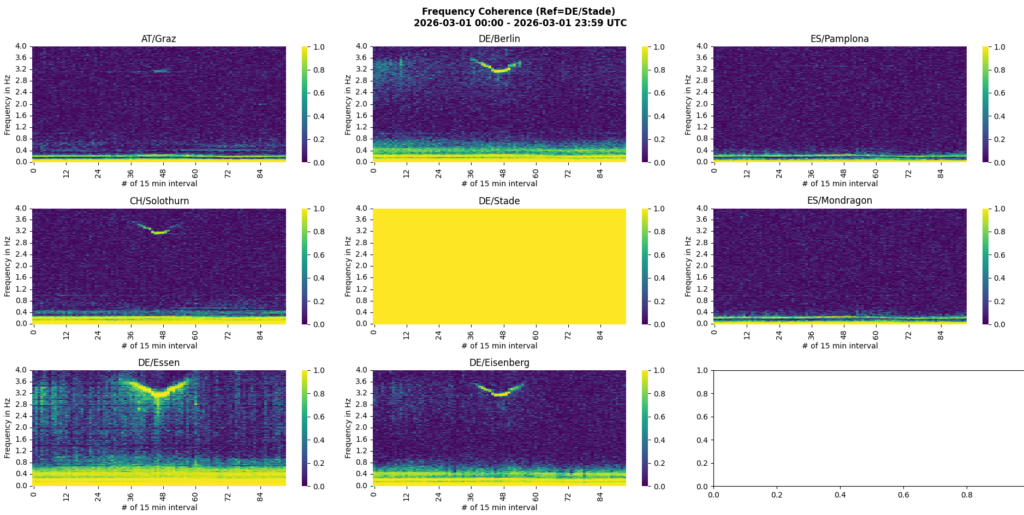
Proving the Connection: Coherence
One tool to prove that local phenomena are actually „global“ is Coherence. This compares the Power Spectral Densities (PSD) of two signals and outputs a weight for each frequency, representing their level of connection.
Another method is to compare time-series behaviour during an event. Below is a switching operation where the power flow changed, causing each voltage phasor to pivot to a new position.
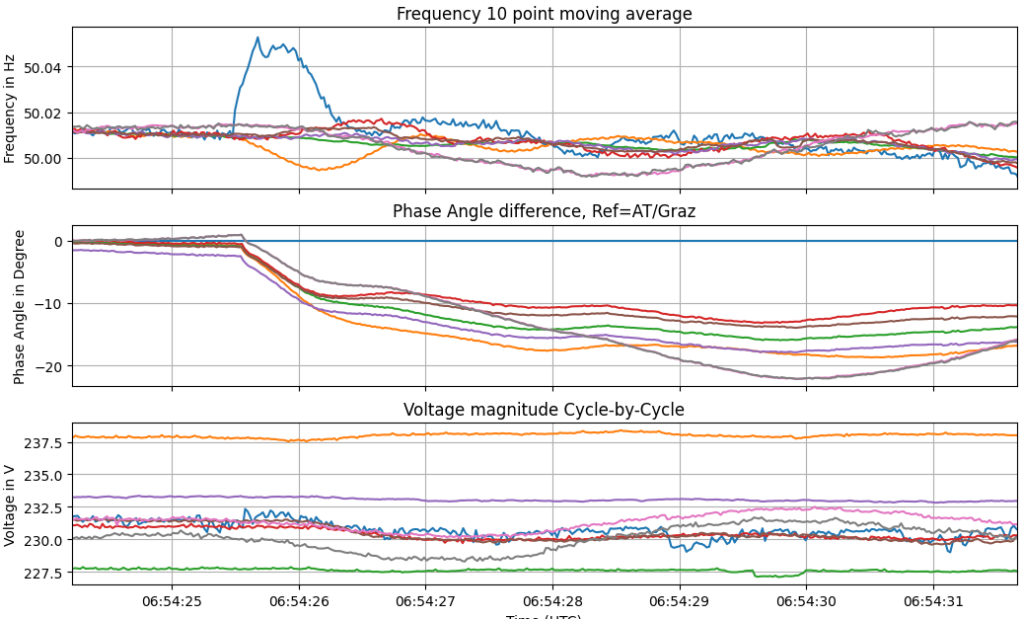
Voltage Magnitude: A Local Character
Unlike frequency, voltage magnitude is highly localized. Most variations and absolute levels are independent over wide areas (typically > 100 km) when measured on the low-voltage side. However, there are notable exceptions:
- High-Voltage Faults: Short circuits in the 110 kV grid (or higher) can be seen across a much wider radius.
- Grid Hierarchy: Usually, voltage is influenced by local generation, local loads, and the impedance of the local line. This means local fluctuations normally do not propagate upward through multiple grid levels.
- Identifying Origins: If a voltage event is detected at multiple locations (> 50 km apart), the origin is typically in the high-voltage transmission grid rather than a local grid.
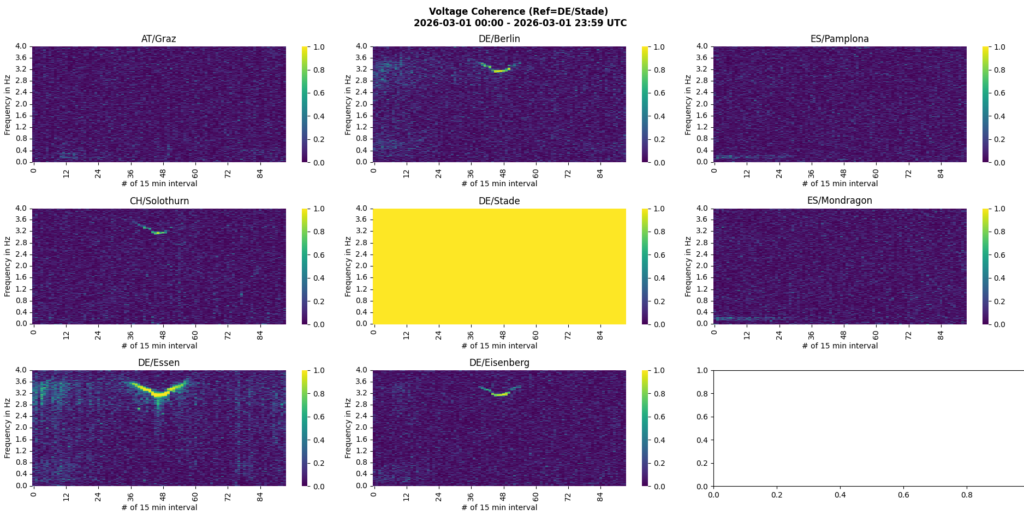
Example 1: Coherence
Here I use the instrument of coherence again to show the „similarity“ in frequency domain of the 1-period voltage effective value.
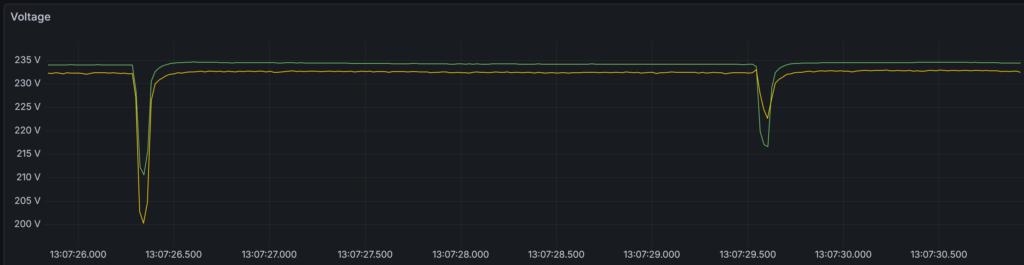
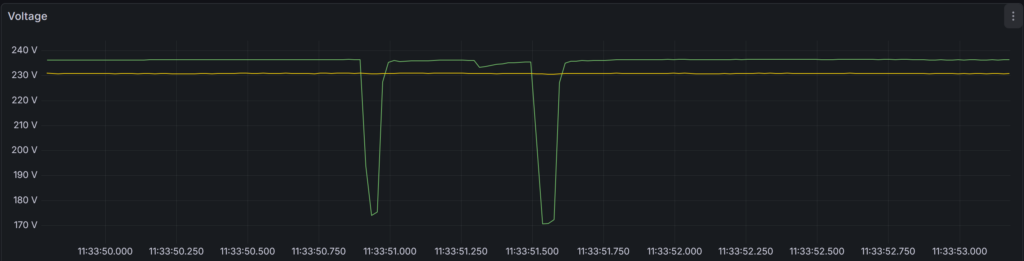
Example 2: Event Impact
Short-term events can also help to see, if it was of local nature or widespread.
Other Parameters (Harmonics and Beyond)
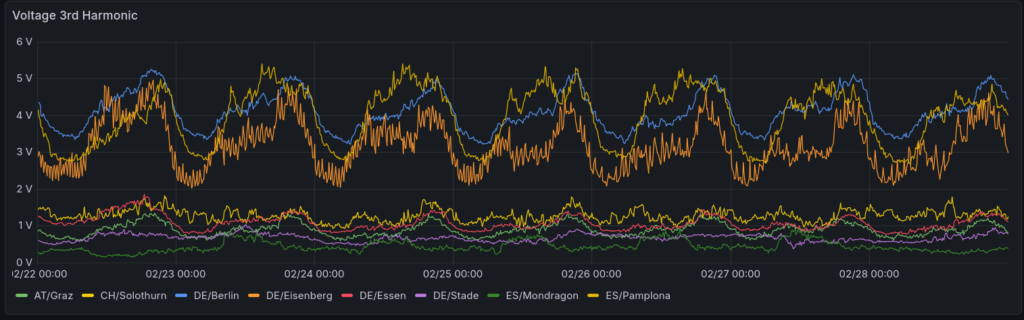
Most other parameters, such as Harmonics, are (most) strictly local and do not propagate over long distances. This is because most distorting loads (and non-linear generators) are connected at the LV or MV levels. Conversely, large-scale generators (synchronous machines) connected at ≥ 110 kV are electrically „clean“ elements.
While voltage harmonics at different sites may occasionally show similar shapes, this is usually due to synchronized human behavior (e.g., industrial shifts or typical daily cycles) rather than electrical propagation. You can clearly see the „signature“ of a typical working day versus a weekend in the time-series data.
Summary
The interconnected nature of our power system means that every local socket is technically a „sensor“ for the entire synchronous area. However, the laws of physics dictate how far different types of „noise“ or signals can travel.
By using high-resolution measurement systems like PQopen and mathematical tools like Coherence, we can distinguish between a local short-circuit and a major switching operation hundreds of kilometers away.
Core Takeaways:
- Frequency is Global: In a synchronized area, frequency is the same everywhere in the „steady state.“ On a dynamic level (high resolution), it reveals the propagation of events and oscillations across the entire grid.
- Voltage is Local: Voltage magnitude is heavily influenced by local impedance and load. If a voltage dip appears at two sites 50+ km apart, it is almost certainly an event originating in the High-Voltage (110 kV+) transmission levels.
- Harmonics are Signatures: Distortions like harmonics rarely travel between grid levels. If you see similar harmonic patterns in different cities, it is likely due to synchronized human behaviour (e.g., industrial shift starts, office hours) rather than electrical propagation (there are exceptions as always)
- Resolution Matters: Traditional 10-minute or even 10-second averages hide the „true“ life of the grid. To see cross-regional dynamics, sub-second measurement resolution is essential.