Welcome to the second report this year of the data acquired with the PQopen measurement network.
Summary
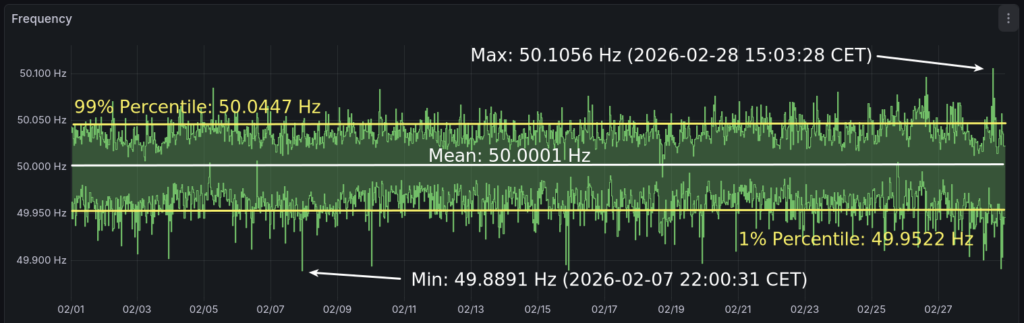
In the summary, the 1s-mean value of the mains frequency is evaluated.
Statistics
Value and occurance
MIN
49.8891 Hz (2026-02-07 22:00:31 CET)
1% Percentile
49.9522 Hz
MEAN
50.0001 Hz (~4,8 seconds fast)
99% Percentile
50.0447 Hz
MAX
50.1056 Hz in CH/Solothurn (2026-02-28 15:03:28 CET)
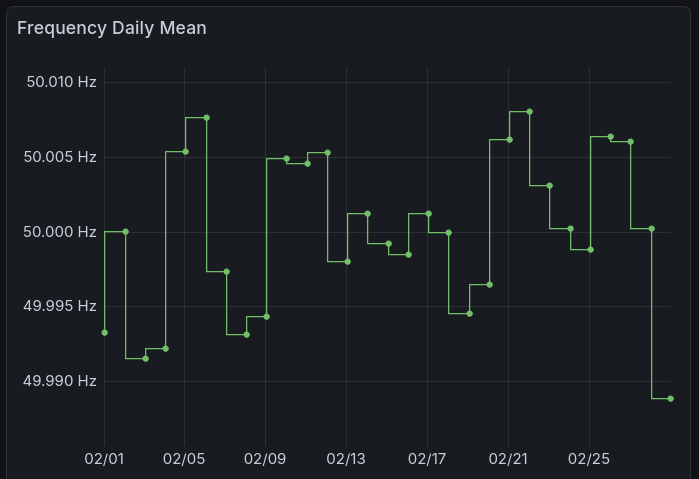
Daily Mean
The daily mean can give you an overview of the „accuracy“ of the grid control and their effect on grid synchronized clocks. Until one day before the end of the month, the average was 50.0004 Hz but resulted in whole February mean of 50.0001 Hz which can be also written as 4.8 seconds fast of time.
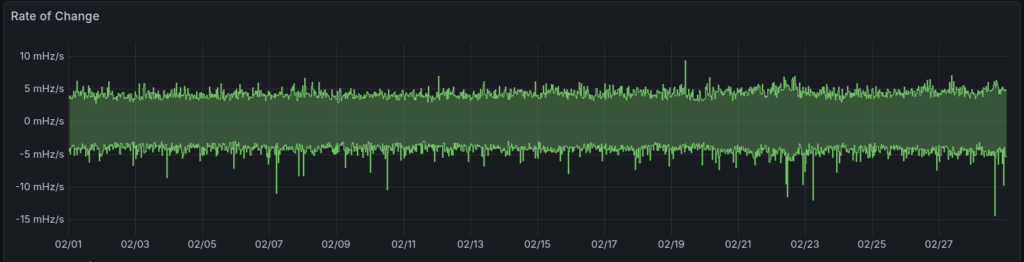
Rate of Change of Frequency (ROCOF)
The ROCOF is an indicator for potential events and the steadiness of the frequency. The higher the value, the more disturbances are at work (oscillations, transients…).
ROCOF of CH/Solothurn: Most of the time between +-5mHz/s with some significant outlier in negative direction.
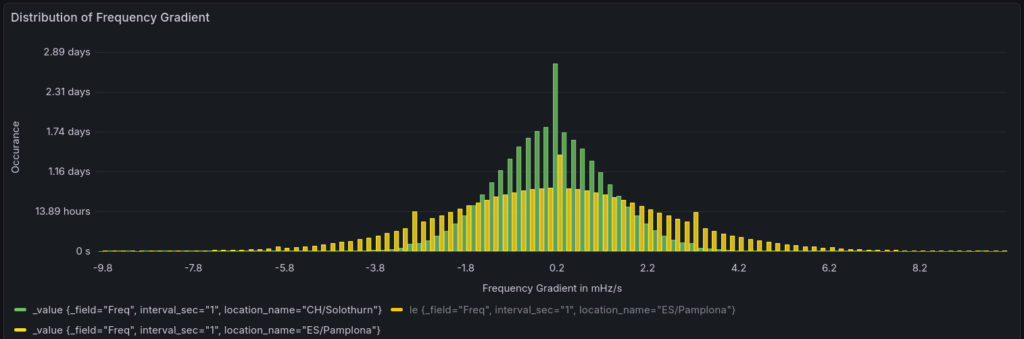
Histogramm of the ROCOF from CH/Solothurn (green) and ES/Pamplona (yellow) in comparison. One can see, the distribution is much wider in Spain than in middle Europe, which is a result of the more significant inter-area oscillations.
Inter-Area oscillations
The inter-area oscillations is a long-known phenomenon resulting from the wide area of interconnected countries. In Spain, two modes can be detected, the east-center-west and the east-west mode.
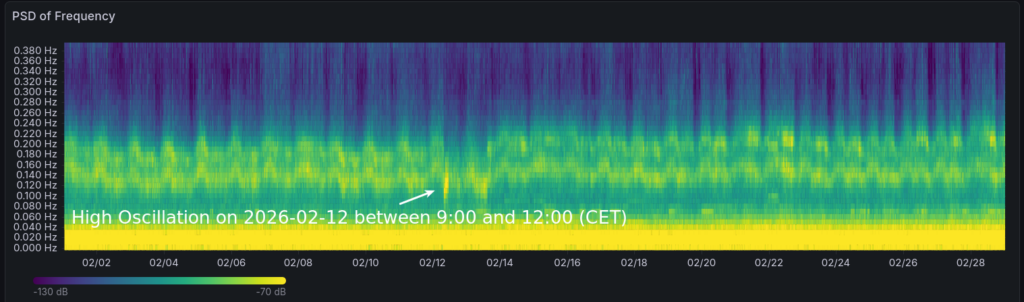
Power spectrum density (PSD) of the measurement location ES/Pamplona.
High Oscillation Amplitude on Iberian Peninsula
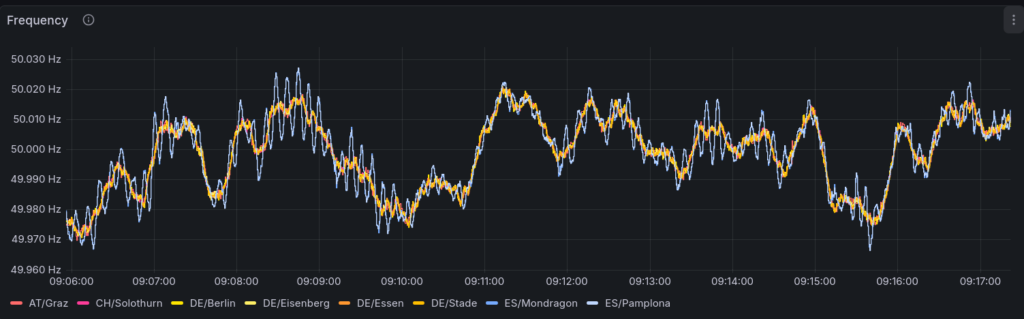
On 12th of February, there was a high oscillation amplitude detected between 9 and 12 o’clock. Here is an example of about 10 Minutes, what was going on:
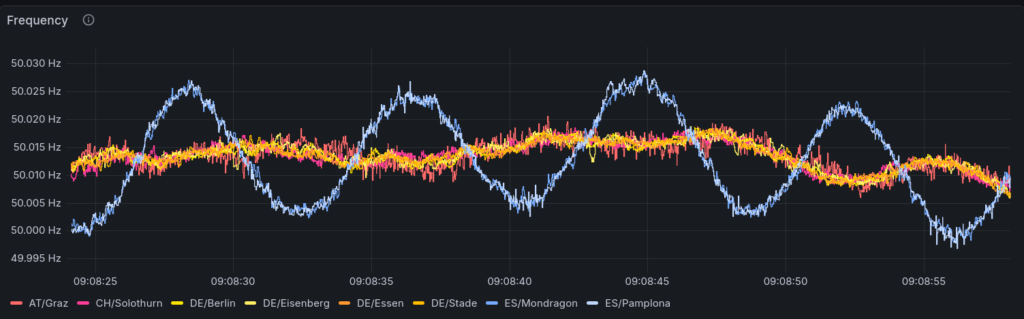
The light blue traces show the two measurement locations in Spain, which were oscillating with about 0.12 Hz.
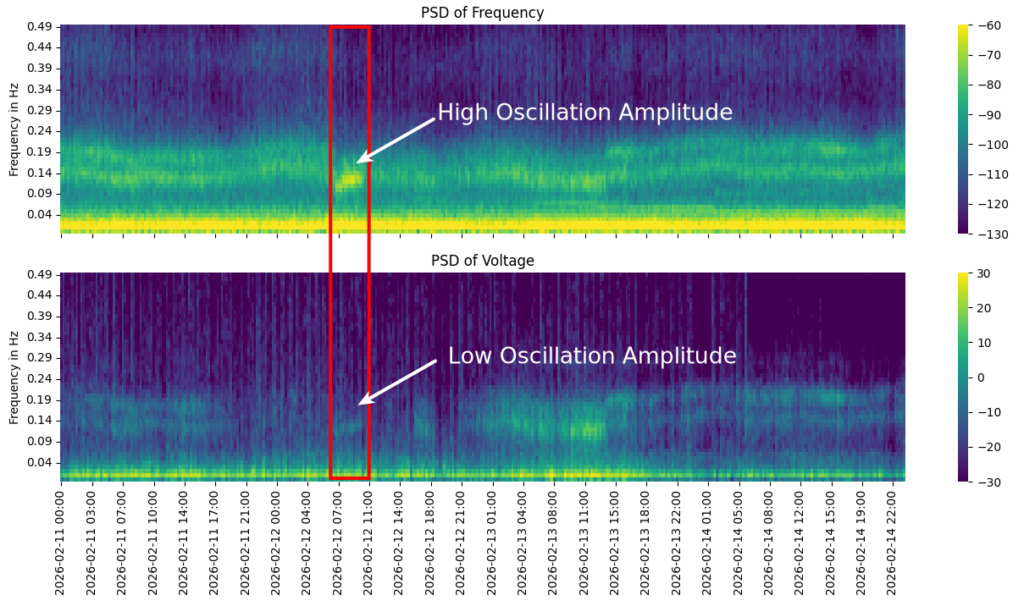
A detailed view of the oscillation on the iberian peninsula. The voltage was surprisingly not affected by this oscillation.
An interesting detail comes to eyes in comparison with the voltage magnitude oscillation. Typically, the voltage is also oscillating with the same frequency, but in the problematic time frame, the behaviour was different. One reason could be, that the power oscillation damping system (POD) was not working properly, these systems mainly adapt the voltage magnitude by changing reactive power (POD-Q).
Other Abnormalities
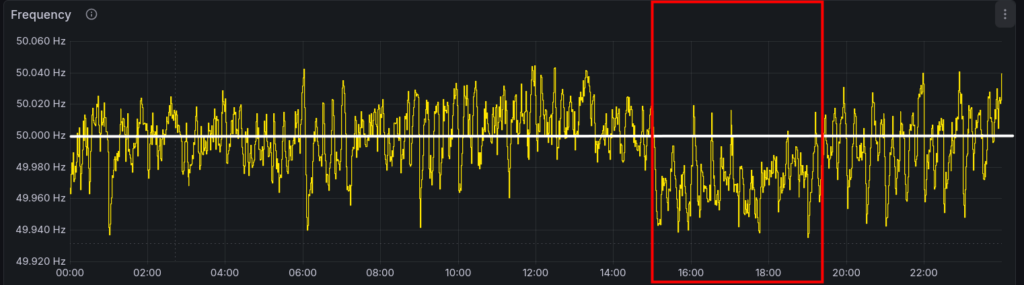
2026-02-18 15:00 – 19:00 (CET): 4-hour phase of low Frequency
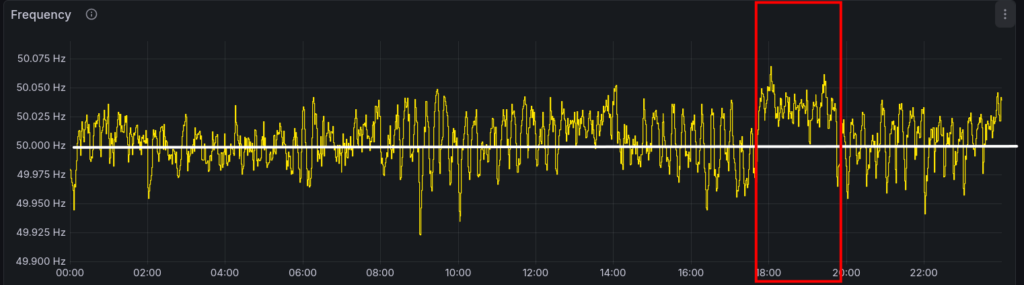
2026-02-25 17:45 – 19:45 (CET): 2-hour phase of high Frequency
Events
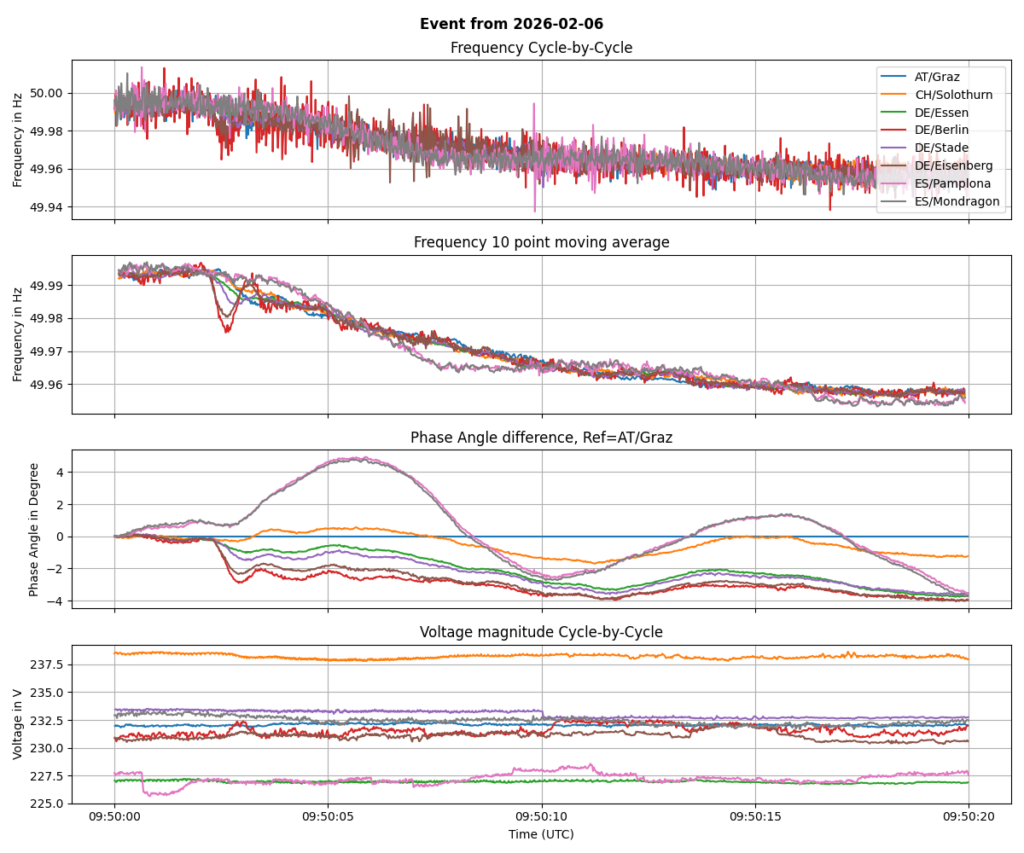
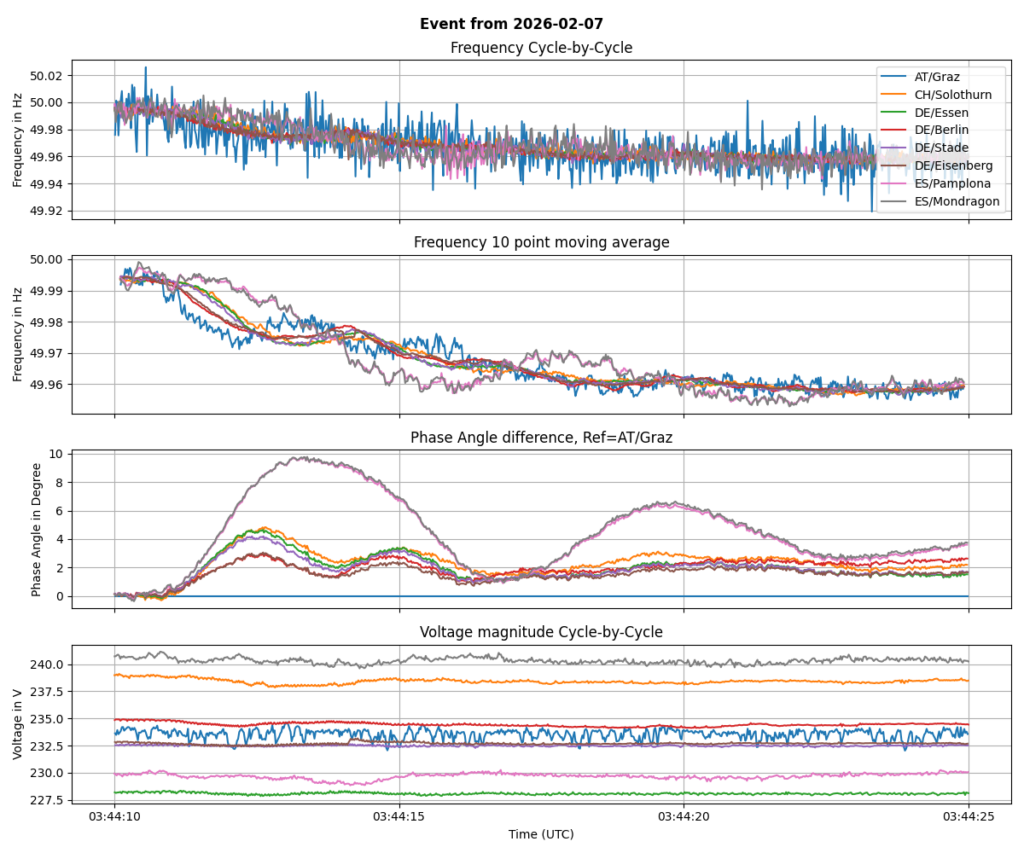
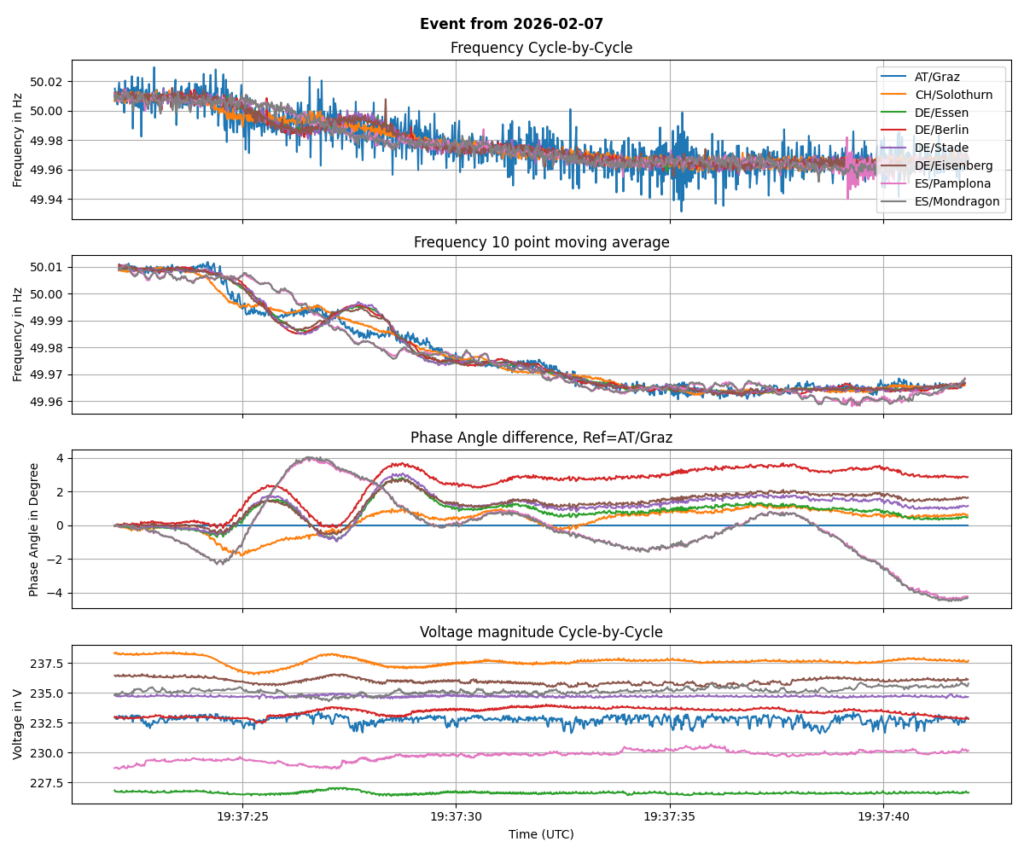
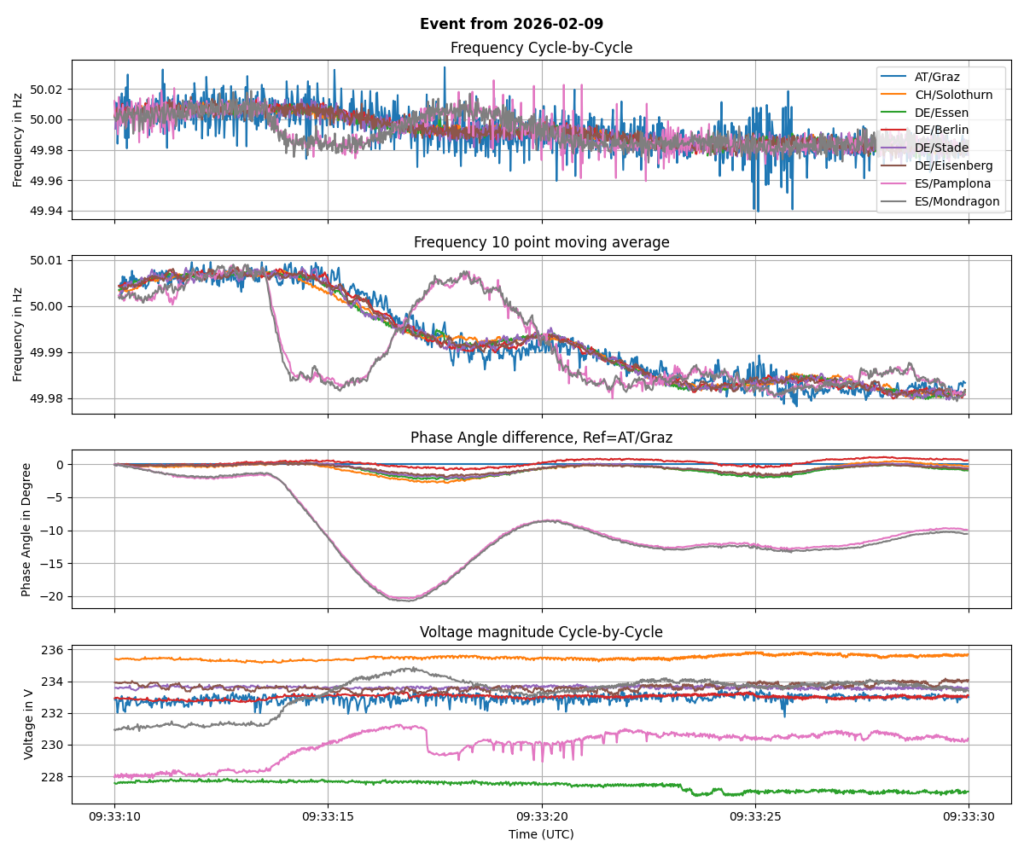
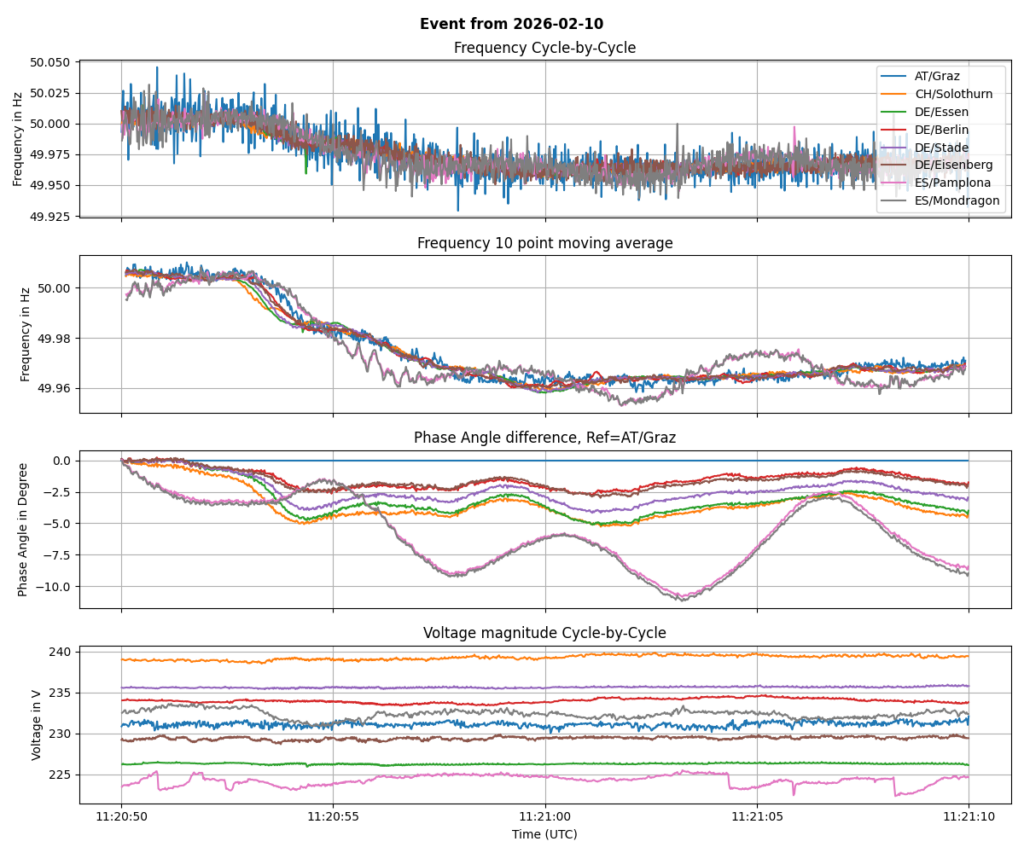
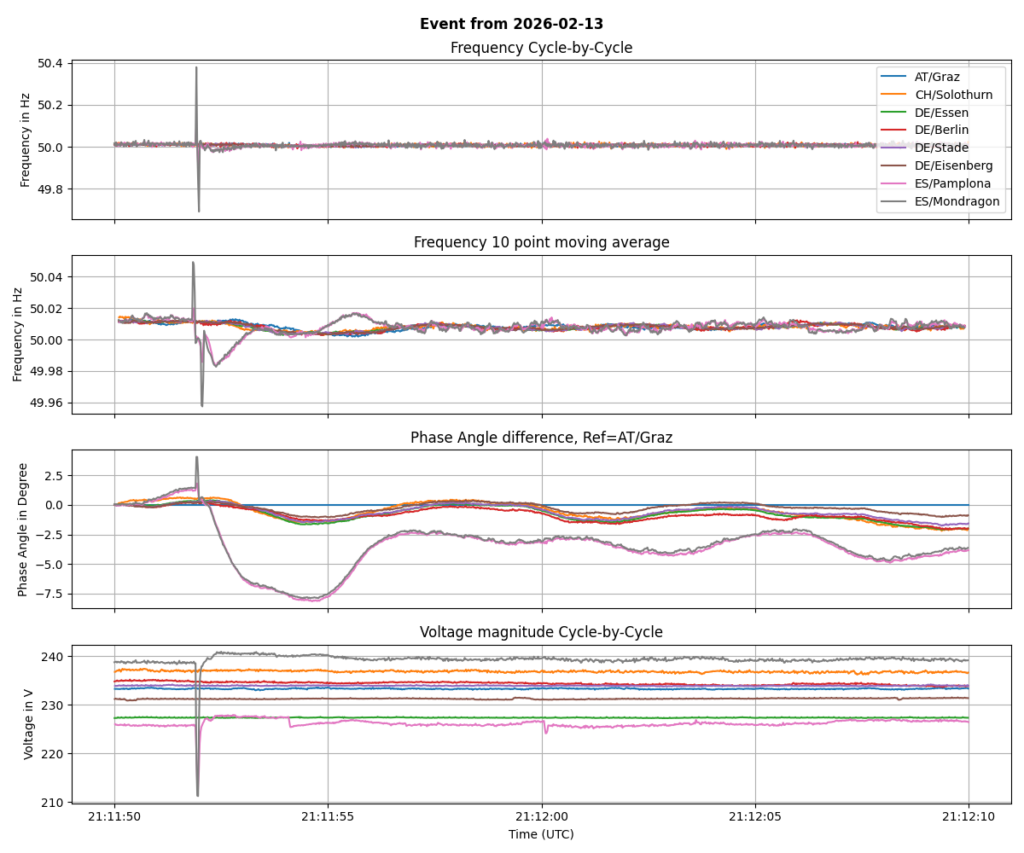
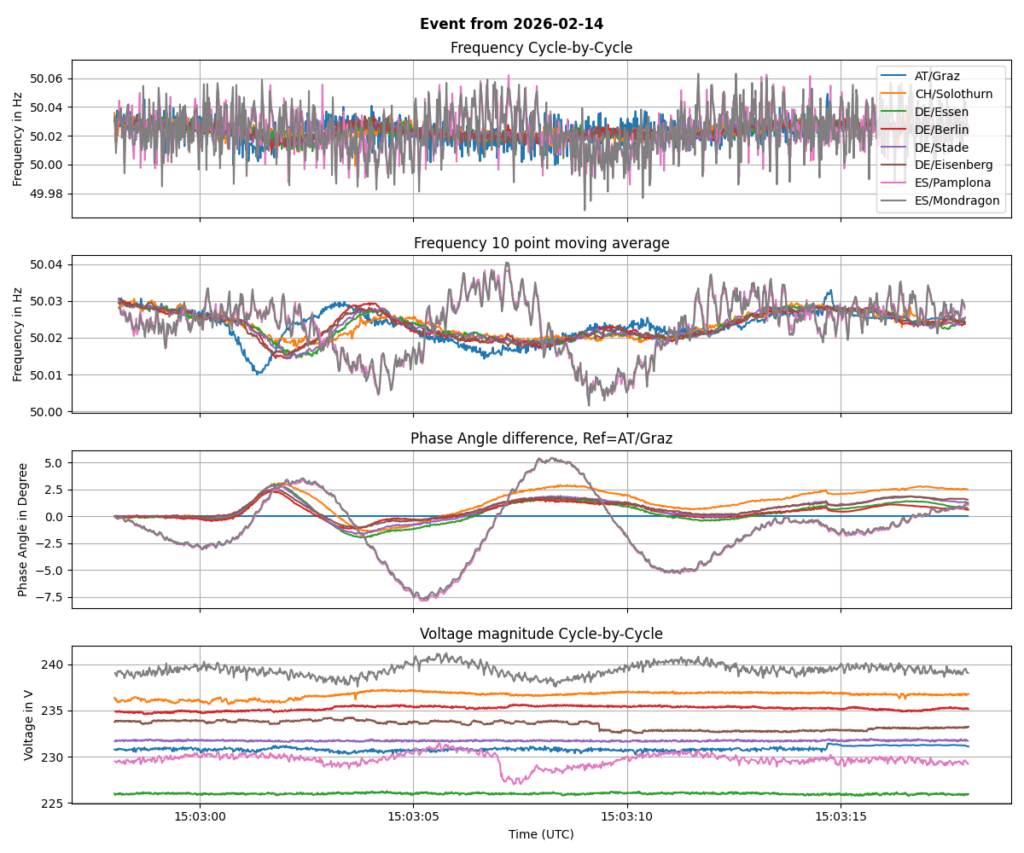
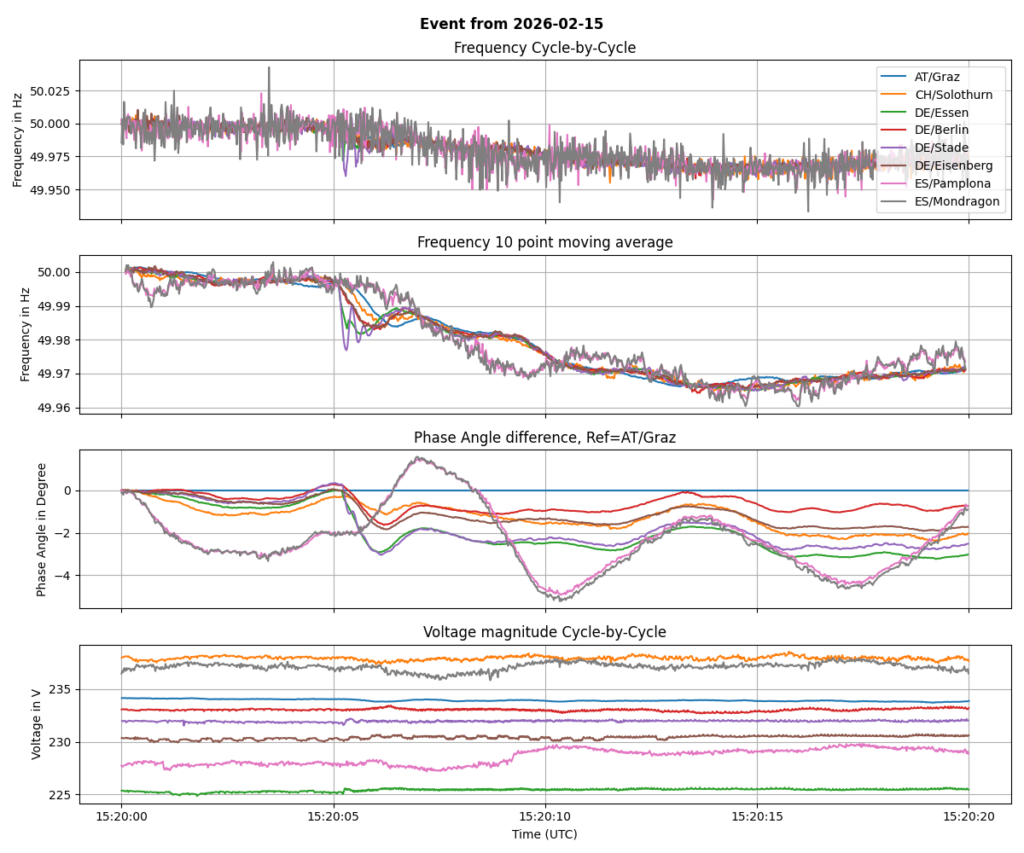
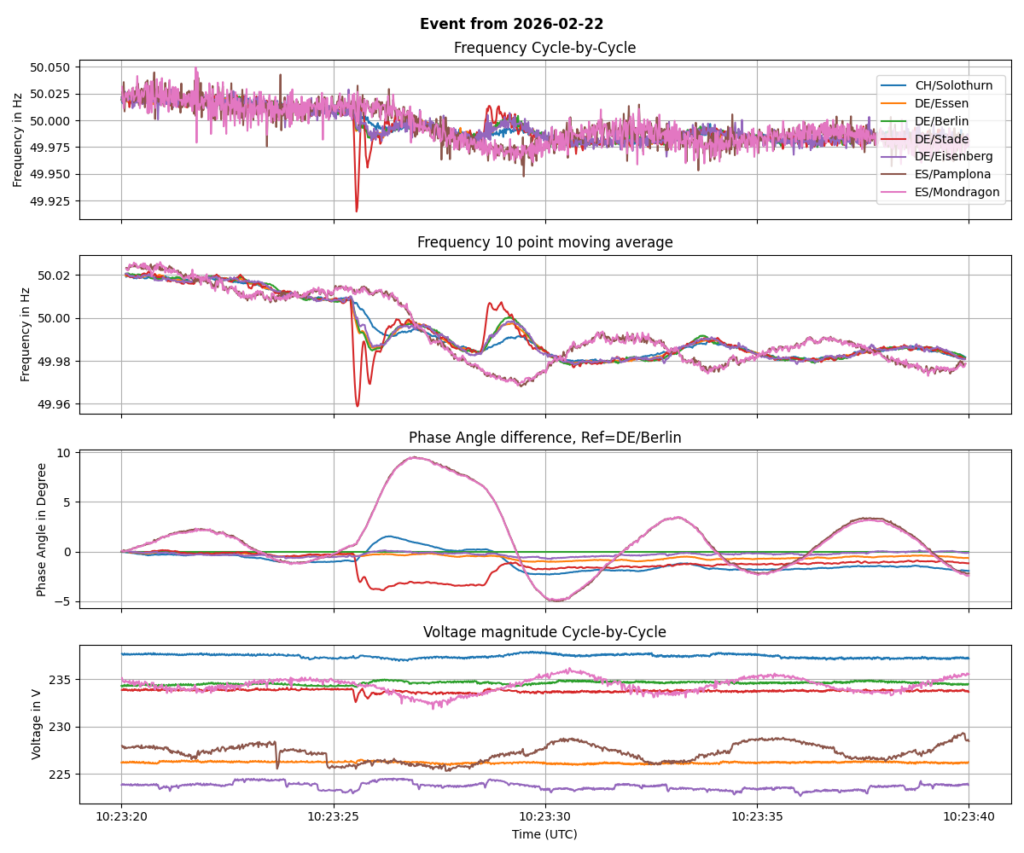
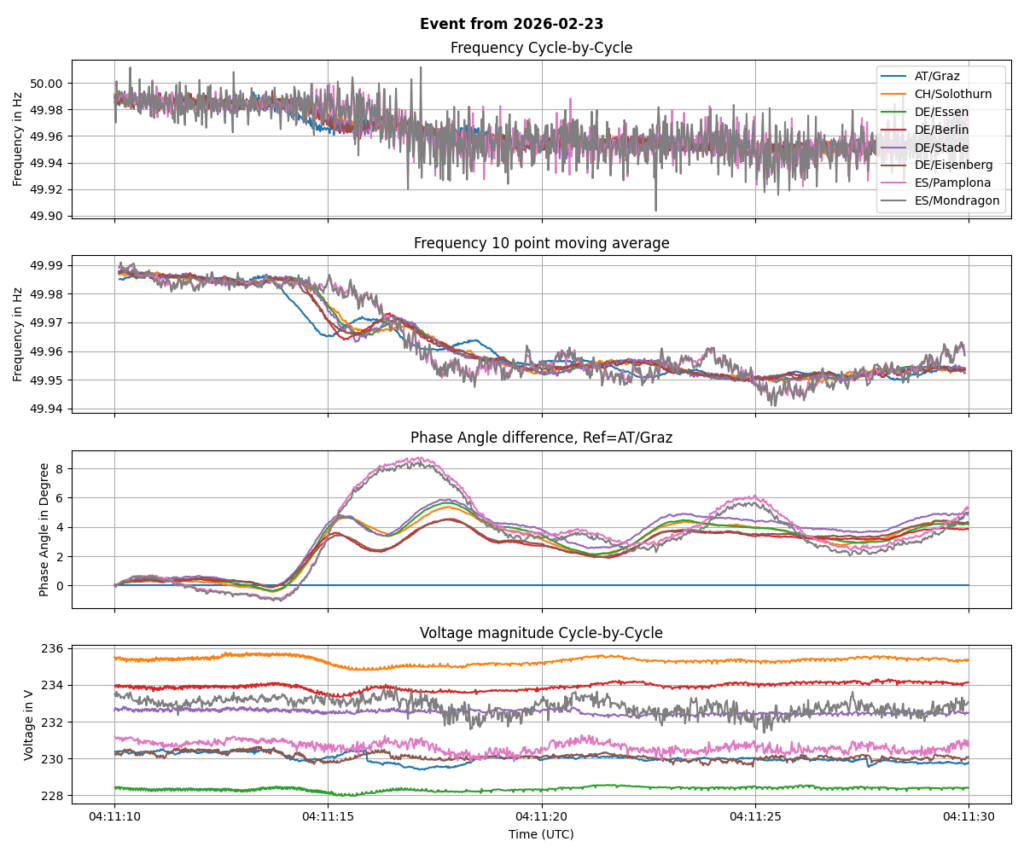
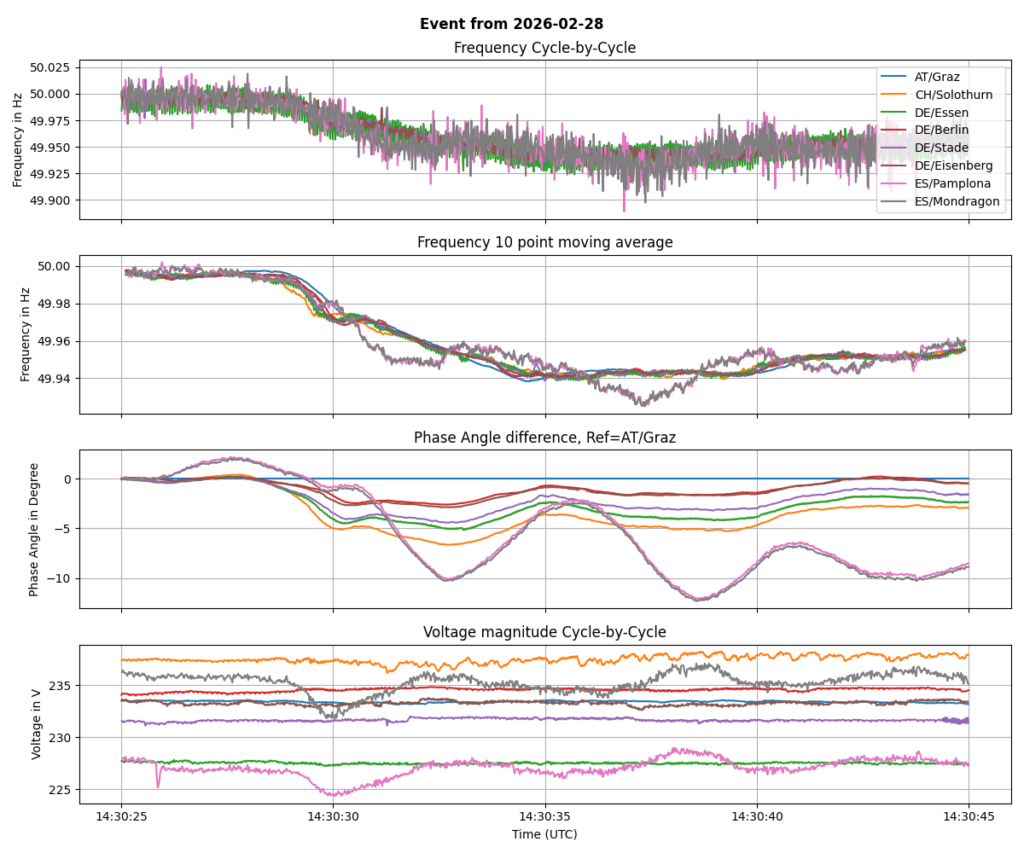
Below, there are several graphs, each representing a detailed time series plot of cycle-by-cycle frequency as well as 10-cycle moving average, phase angle difference and voltage magnitude.
Some readers had the idea of automatically analyzing these traces and doing some sort of „triangulation“ for estimating the area of event root. I had no time in february to give it a try, but it is on my list. If someone of you is interested of trying this, please use the archived data or the API for more recent events.
2026-02-06 09:50:02 (UTC): Possible loss of generation in Germany or northern-eastern Europe
2026-02-07 03:44:11 (UTC): Possible loss of generation in eastern Europe
2026-02-07 19:37:24 (UTC): Loss of generation in western Europe
2026-02-09 09:33:13 (UTC): Loss of generation in Spain
2026-02-10 11:20:52 (UTC): Outage of nuclear power plant Penly 1 (1330 MW) in France
2026-02-13 21:11:51 (UTC): Short circuit in Spain
2026-02-14 15:03:00 (UTC): Unknown event in southern-east Europe (AT/Graz was leading)
2026-02-15 15:20:05 (UTC): Loss of generation in northern Germany
2026-02-22 09:23:26 (UTC): Short loss of generation in northern Germany (DE/Stade is in different color than in the last graph because no data from AT/Graz)
2026-02-23 04:11:14 (UTC): Loss of generation in sourthern-east Europe
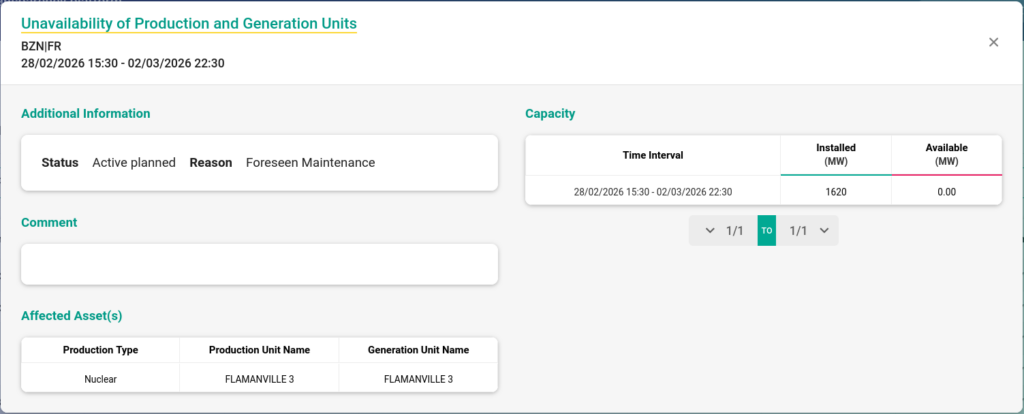
2026-02-28 14:30:28 (UTC): Loss of generation in France: FLAMANVILLE 3 (1620 MW) was noted in transparency.entsoe.eu as Foreseen Maintenance, but the frequency „says“ hard loss: