Welcome to the new format of reporting of the data acquired with the PQopen measurement network.
Summary
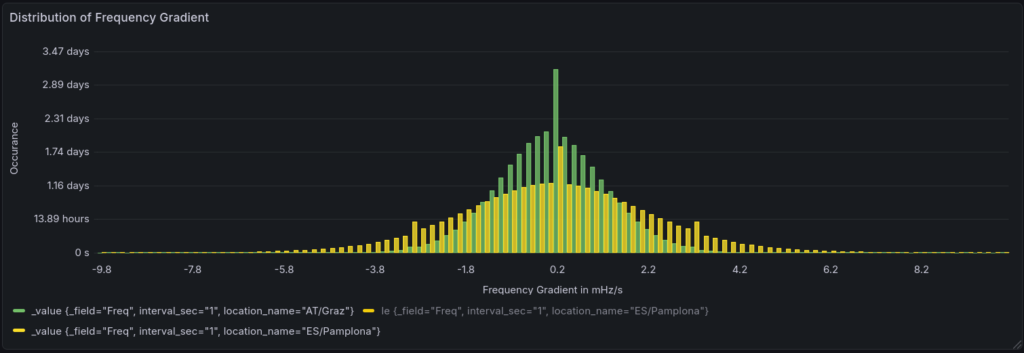
In the summary, the 1s-mean value of the mains frequency is evaluated.
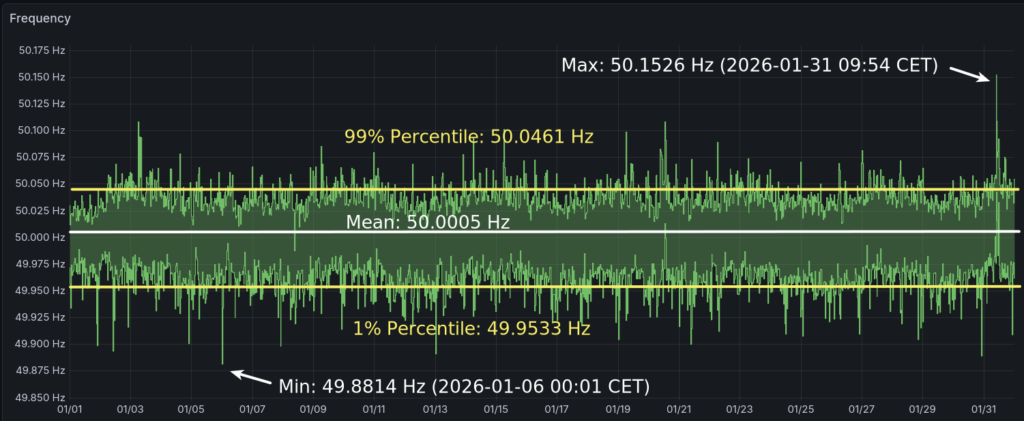
| Statistics | Value and occurance |
|---|---|
| MIN | 49.8814 Hz (2026-01 00:01 CET) |
| 1% Percentile | 49.9533 Hz |
| MEAN | 50.0005 Hz (~27 seconds fast) |
| 99% Percentile | 50.0461 Hz |
| MAX | 50.1488 Hz in AT/Graz (2026-01-31 09:54 CET) 50.1526 Hz in ES/Pamplona |
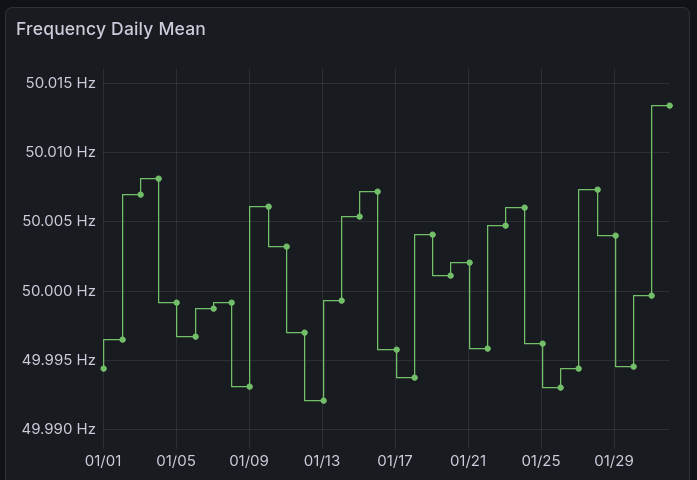
Daily Mean
The daily mean can give you an overview of the „accuracy“ of the grid control and their effect on grid synchronized clocks. Until the event on 31st of January, the average was 50.0000 Hz but resulted in whole January mean of 50.0005 Hz which can be also written as 27 seconds fast of time.
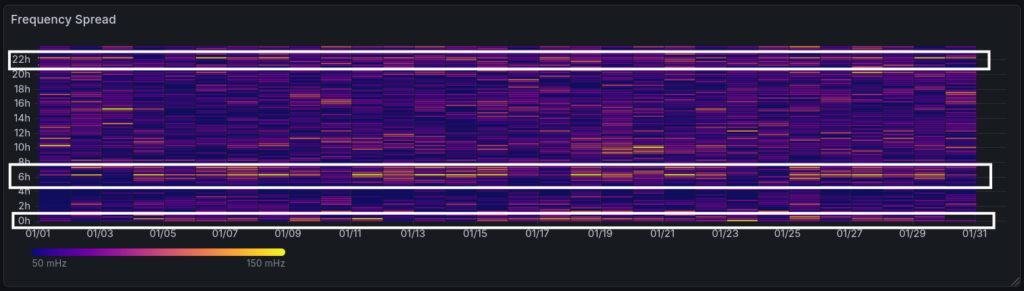
Frequency Spread
In this graph, I want to show the frequency spread (max-min in 15min intervals) for visualising common patterns. As long known, the most frequency span are in the morning hours, at the evening and around midnight, mostly due to market impact.
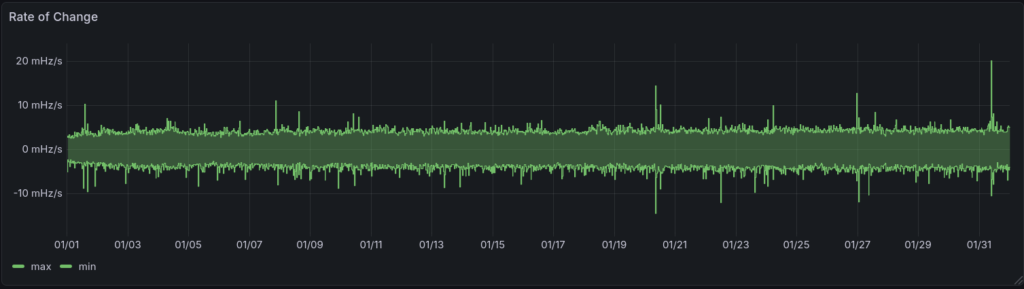
Rate of Change of Frequency (ROCOF)
The ROCOF is an indicator for potential events and the steadiness of the frequency. The higher the value, the more disturbances are at work (oscillations, transients…).
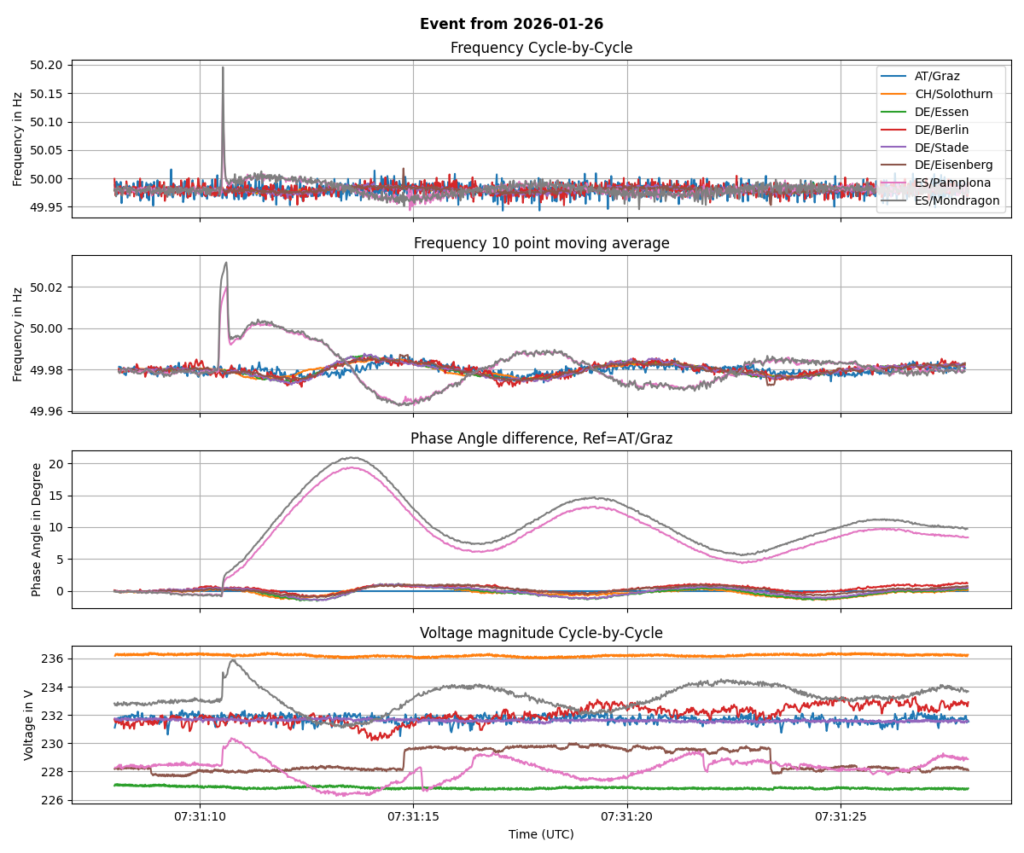
Inter-Area oscillations
The inter-area oscillations is a long-known phenomenon resulting from the wide area of interconnected countries. In Spain, two modes can be detected, the east-center-west and the east-west mode.
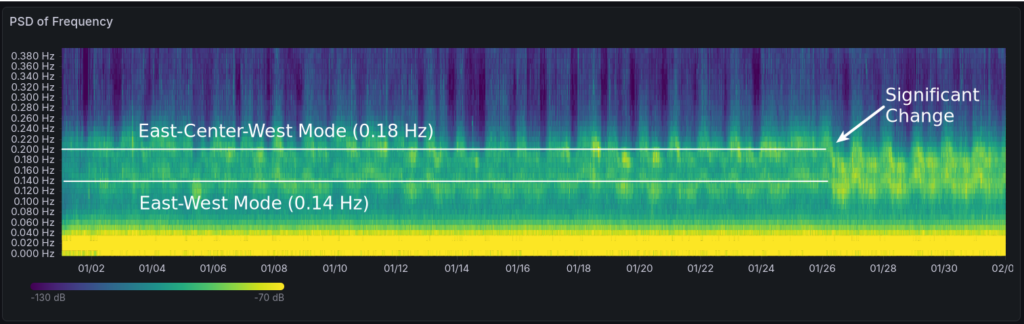
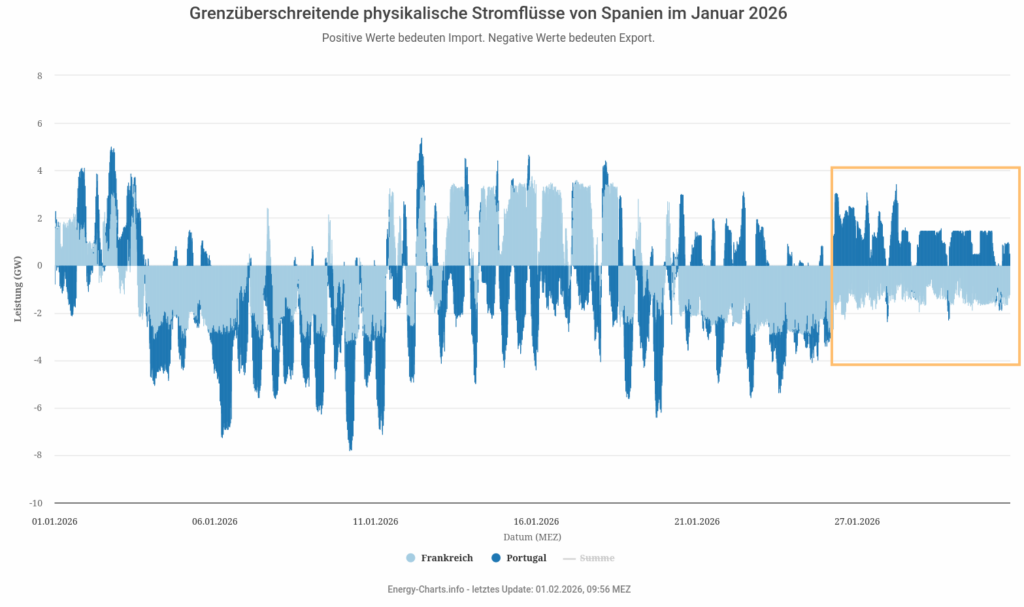
There was a change in characteristics on the 26th of January. Both modes rose in magnitude and the east-center-west mode dropped in frequency. An explanation can be found in the power flow in Spain.
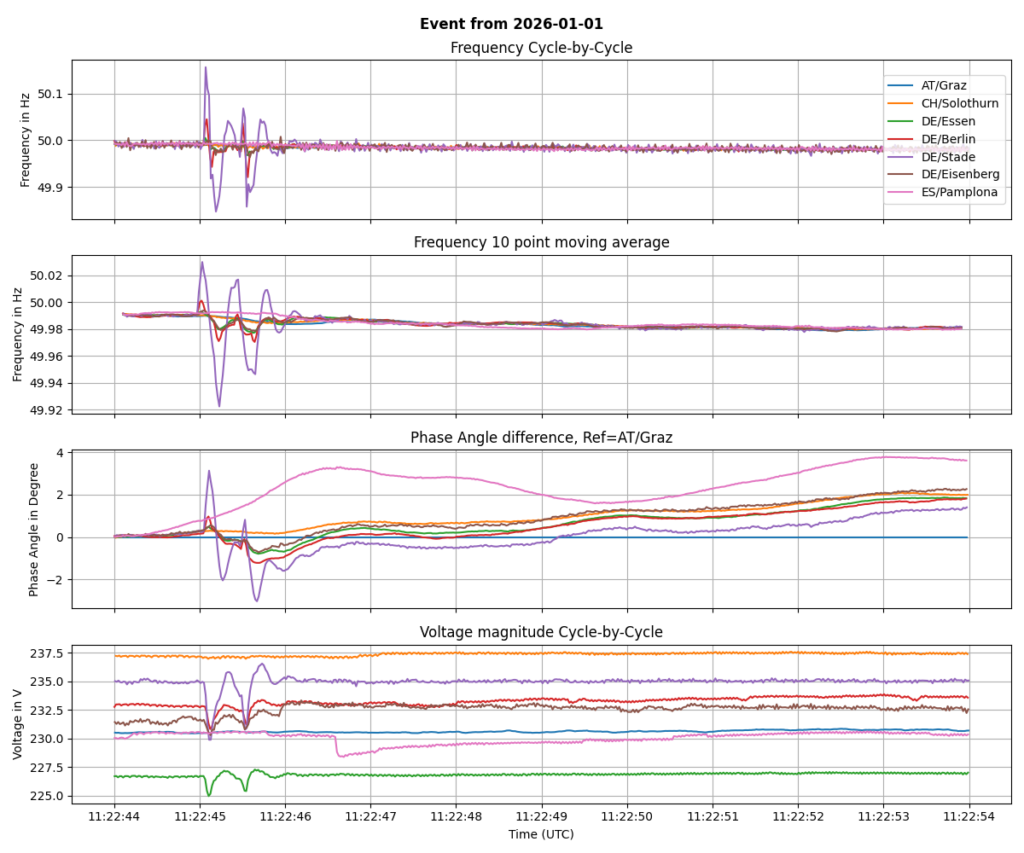
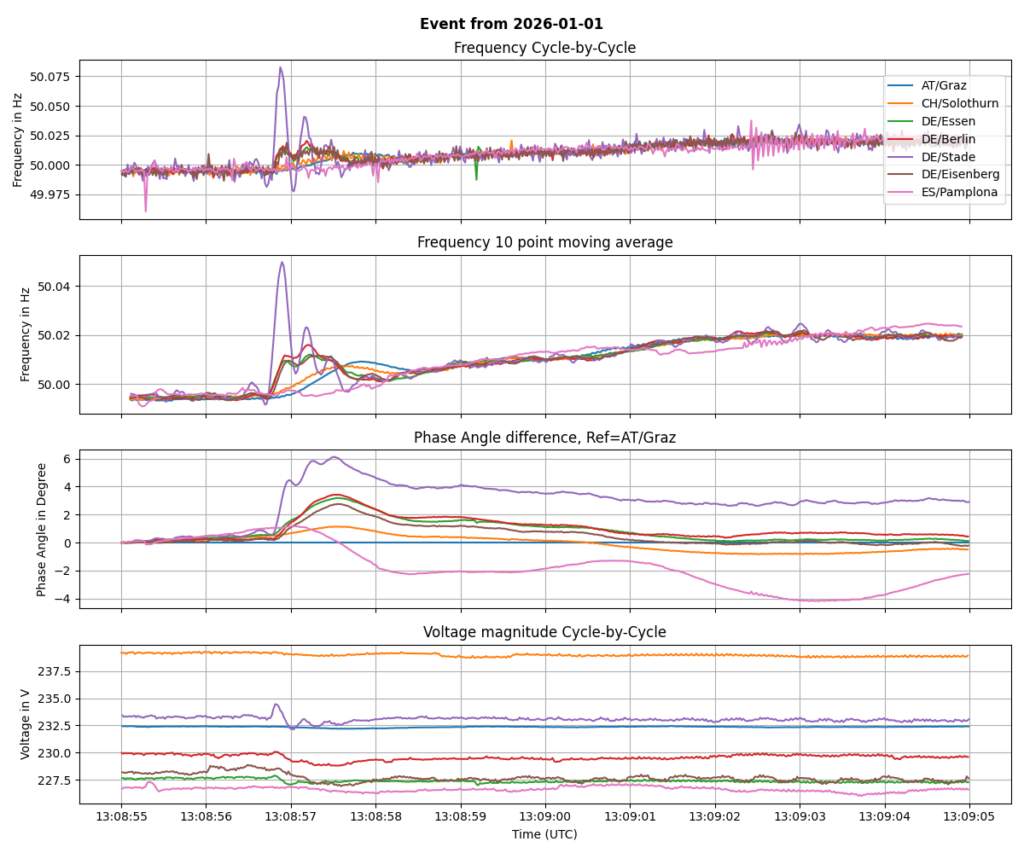
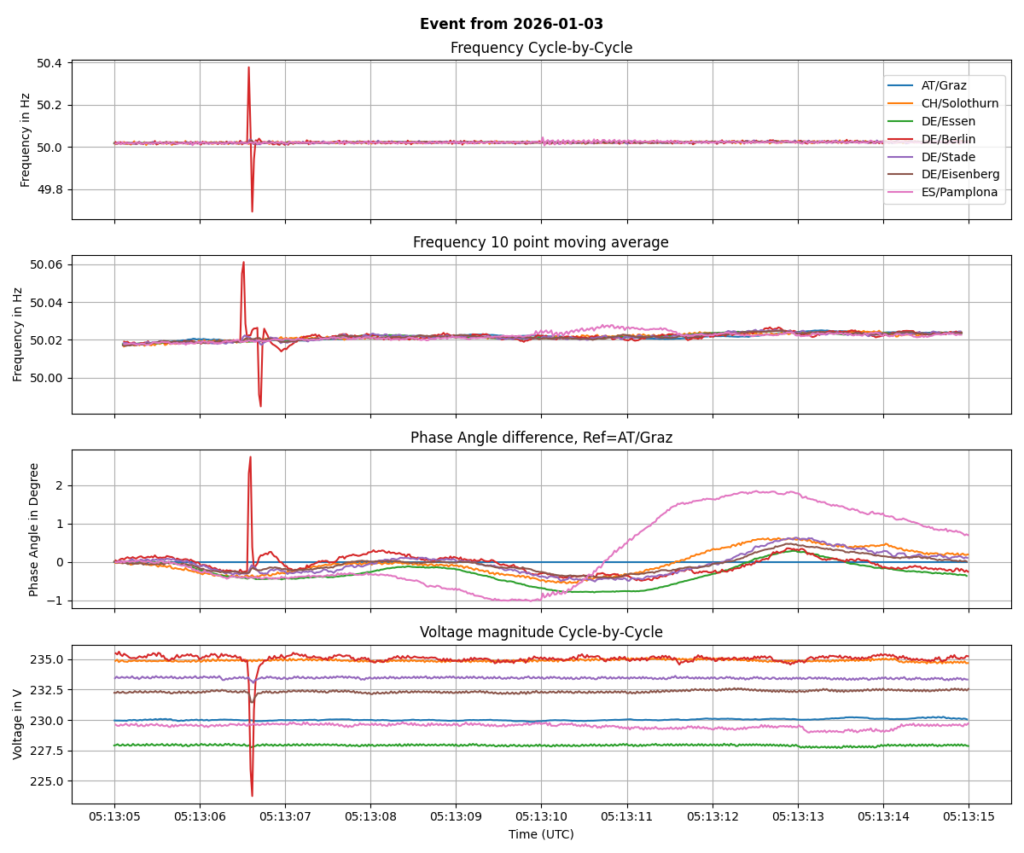
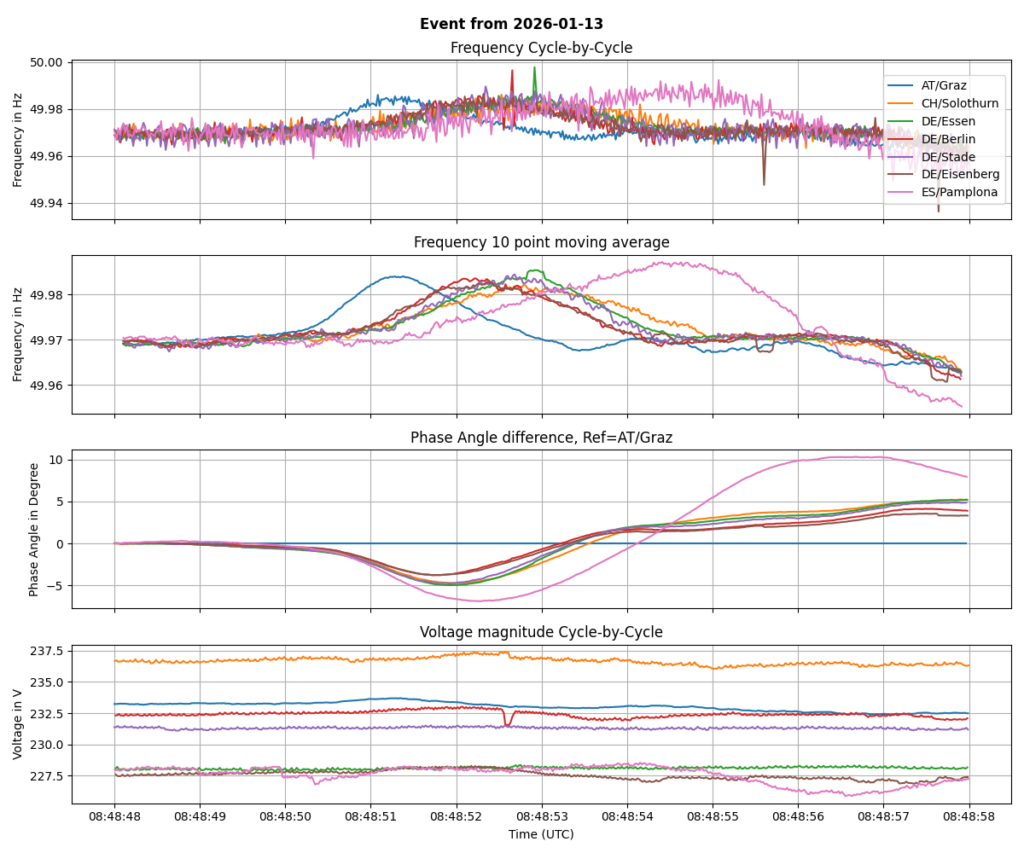
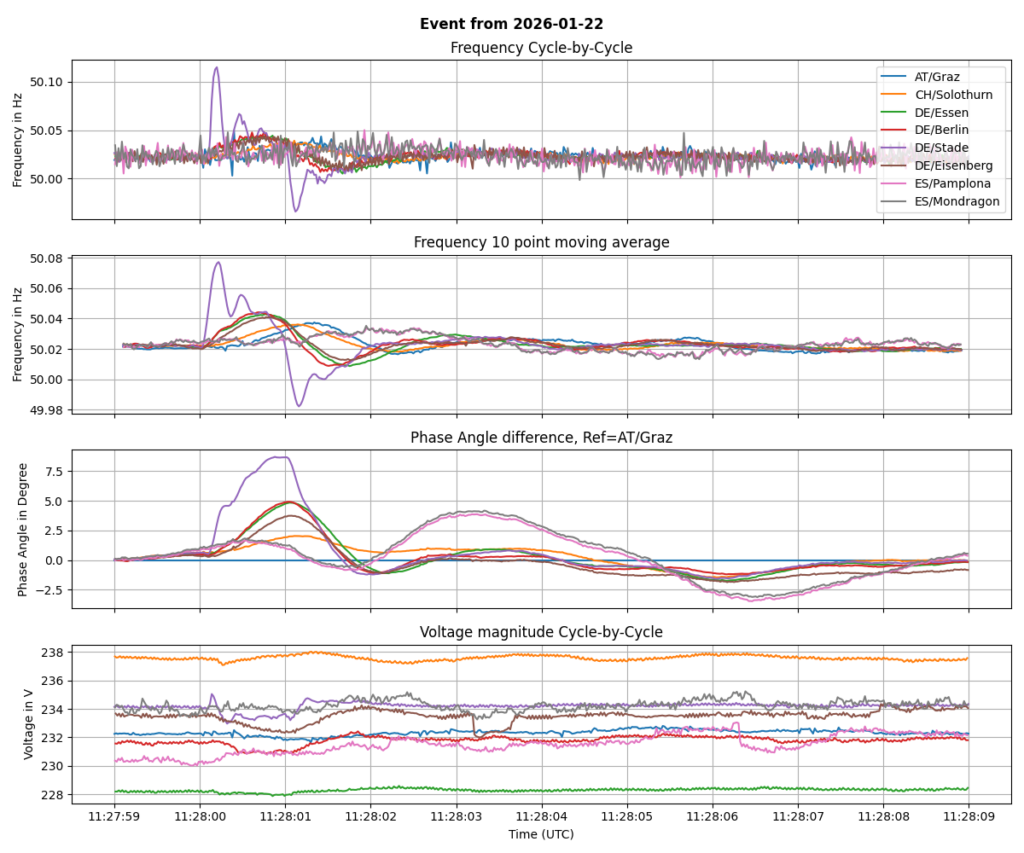
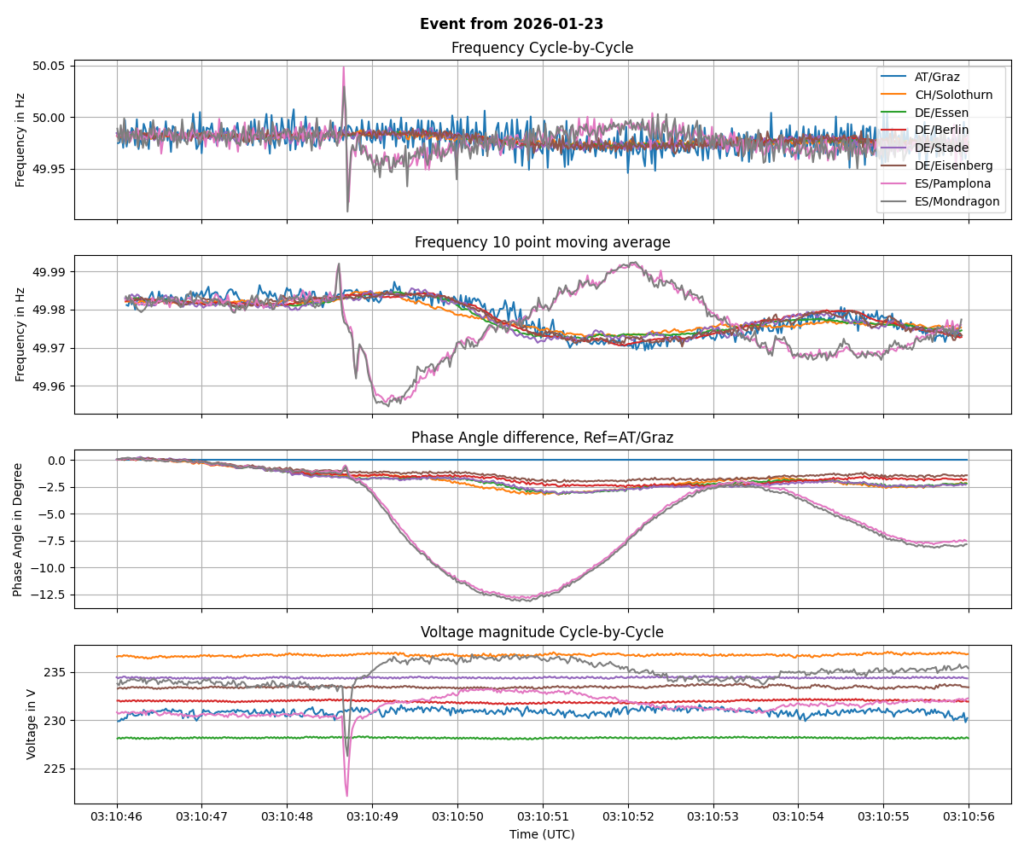
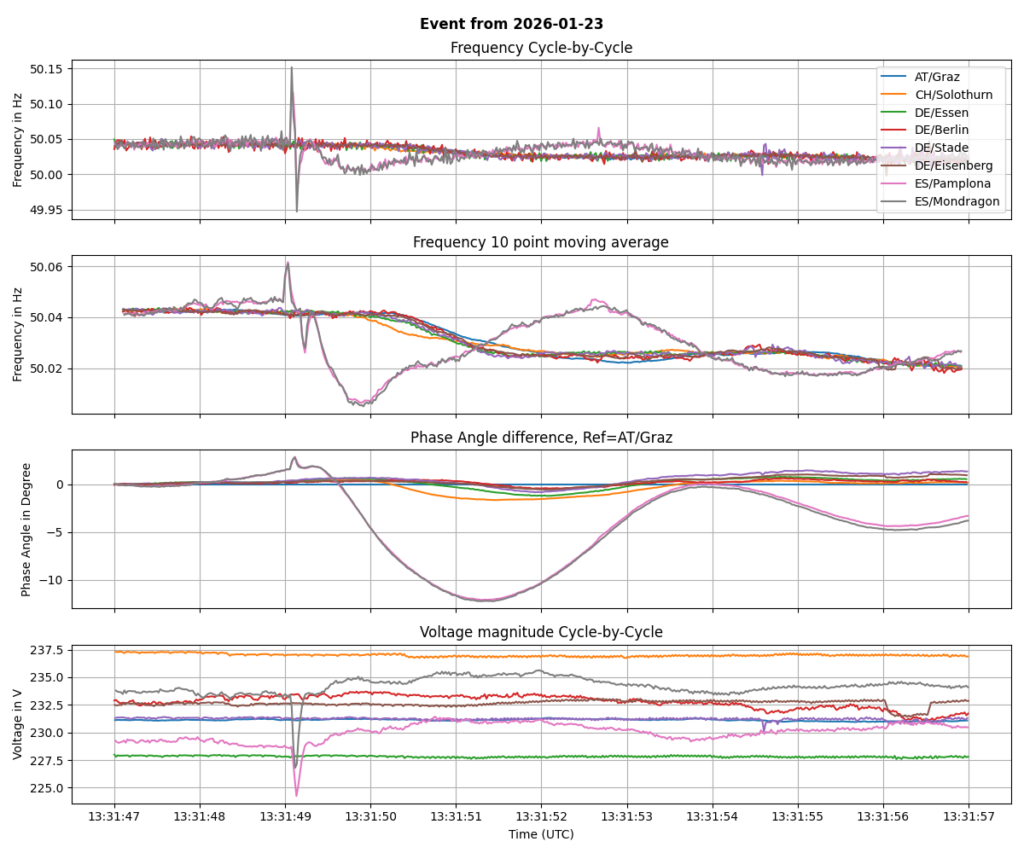
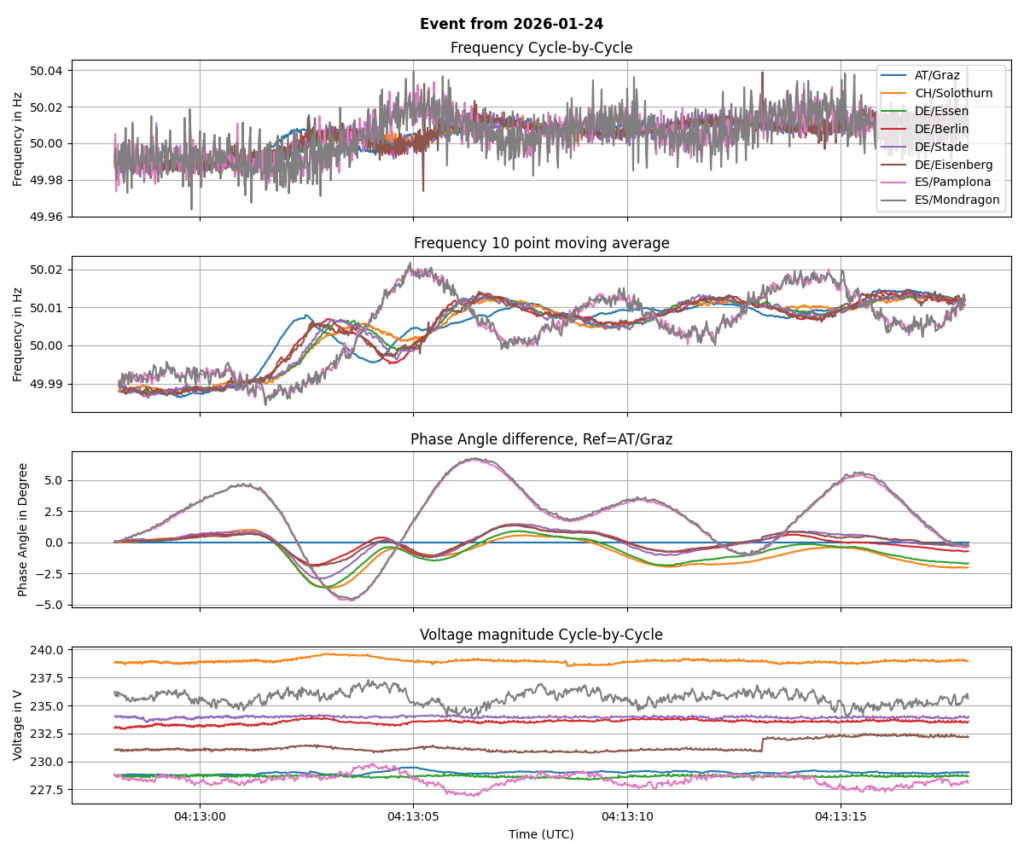
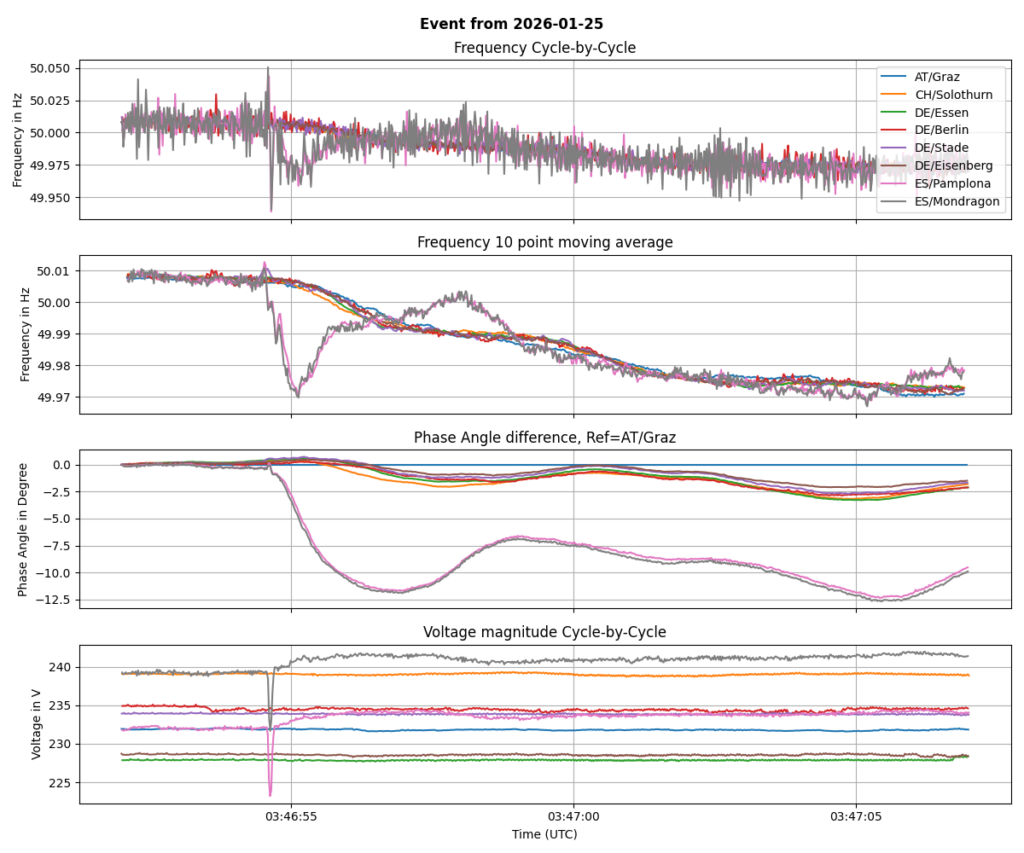
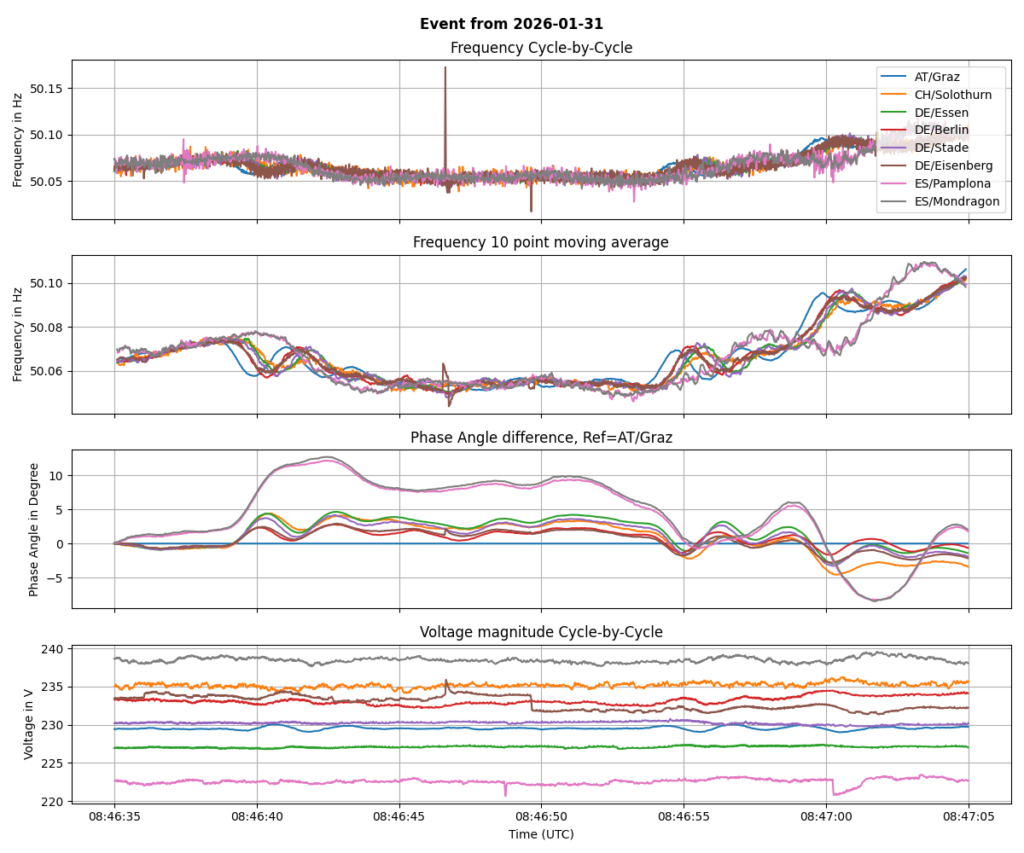
Events
Below, there are several graphs, each representing a detailed time series plot of cycle-by-cycle frequency as well as 10-cycle moving average, phase angle difference and voltage magnitude.