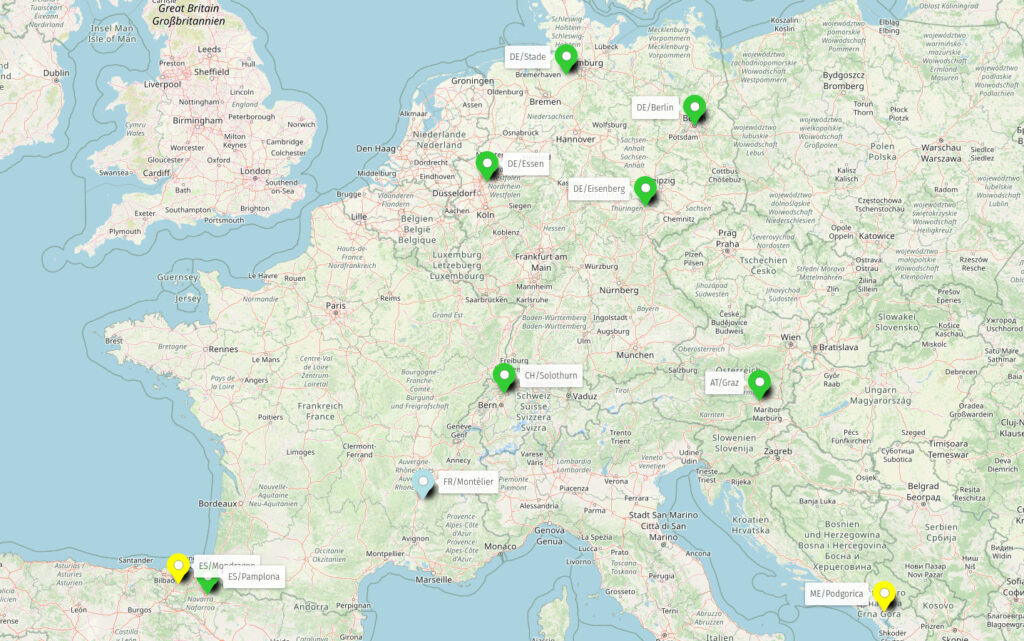
Time goes by so fast – PQopen is now online for half a year now. Started in June 2025 with one measurement location in AT/Graz, now operating 7 remote measurements, hosted by tech enthusiasts in three additional countries.
About PQopen
PQopen is an open measurement project aiming to make grid-level frequency and power-quality dynamics visible across Europe. By operating synchronized, high-resolution measurement devices in private households and labs, we can observe how local events propagate through the interconnected power system.
Some numbers
During this time, many data has been collected and processed, let’s have a look at some numbers of the data transmission and reliability of the system so far.
| Location | Availability since start | Availability last 21d |
|---|---|---|
| AT/Graz | 99.93 % | 99.99 % |
| DE/Berlin | 99.90 % | 100.0 % |
| DE/Essen | 99.99 % | 100.0 % |
| DE/Eisenberg | 99.99 % | 100.0 % |
| DE/Stade | 99.97 % | 100.0 % |
| CH/Solothurn | 99.99 % | 100.0 % |
| ES/Pamplona | 99.98 % | 100.0 % |
Maintaining a consistently high data availability across geographically distributed, privately hosted devices is challenging. Most interruptions observed so far are not caused by the measurement hardware itself, but by infrastructure around it.
The most common cause of data gaps are local WiFi connection issues. In some cases, the automatic reconnect mechanism does not recover immediately after a network interruption, leading to longer outages until manual intervention or a device reboot.
On the backend side, short availability drops occurred during phases of high system load, primarily caused by temporary database or system overload. These issues have been largely mitigated by introducing rate limiters at the frontend. As reflected in the “last 21 days” column, the overall system stability has improved noticeably over time.
Given that PQopen devices are hosted in private networks without redundant internet connections, an availability above 99.9% can be considered very good. Several locations already approach or exceed 99.99%, which is typically only expected from professionally hosted systems.
Accumulated number of measurement points
Due to high granularity of the measurement data (50 Samples per second for Frequency and RMS and more parameters every 1s), many samples are transmitted every day.
| Interval | Number of Samples per Device | Number of Samples total (7 devices) |
|---|---|---|
| 1 Second | 110 | 770 |
| 1 Hour | 396 000 | 2 772 000 |
| 1 Day | 9 504 000 | 66 528 000 |
| 1 Week | 66 528 000 | 465 696 000 |
| 1 Month | 285 120 000 | 1 995 840 000 |
Observations
Frequency
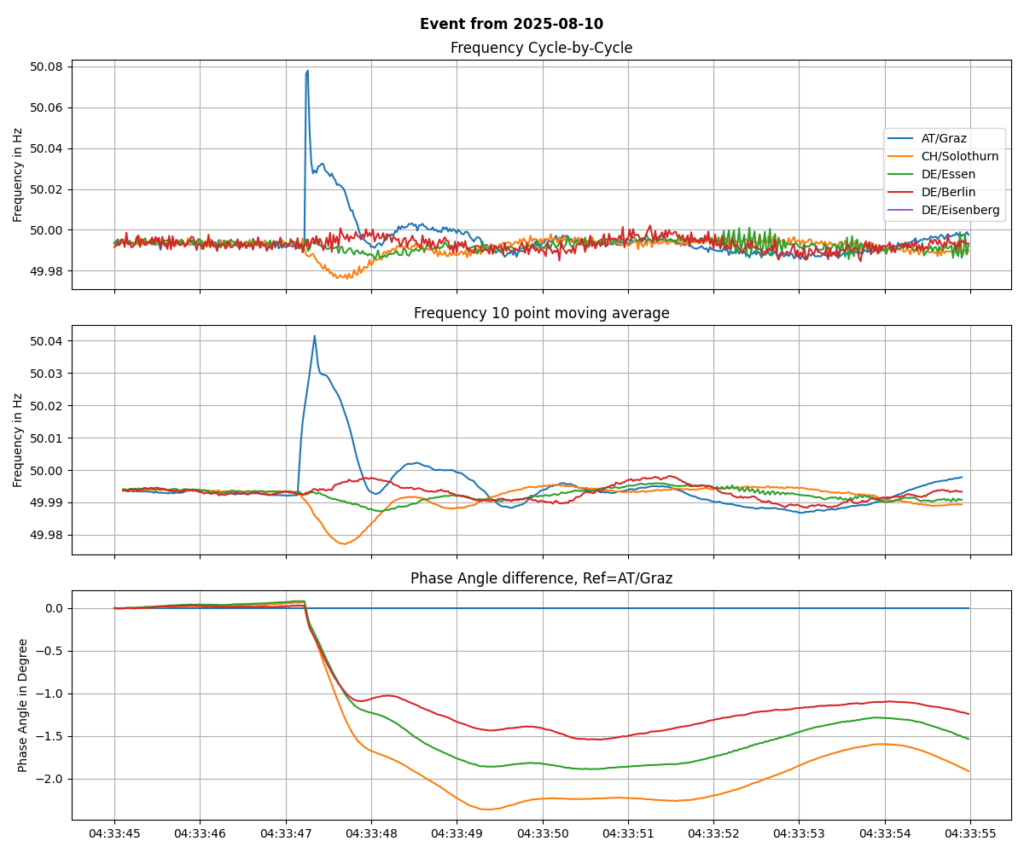
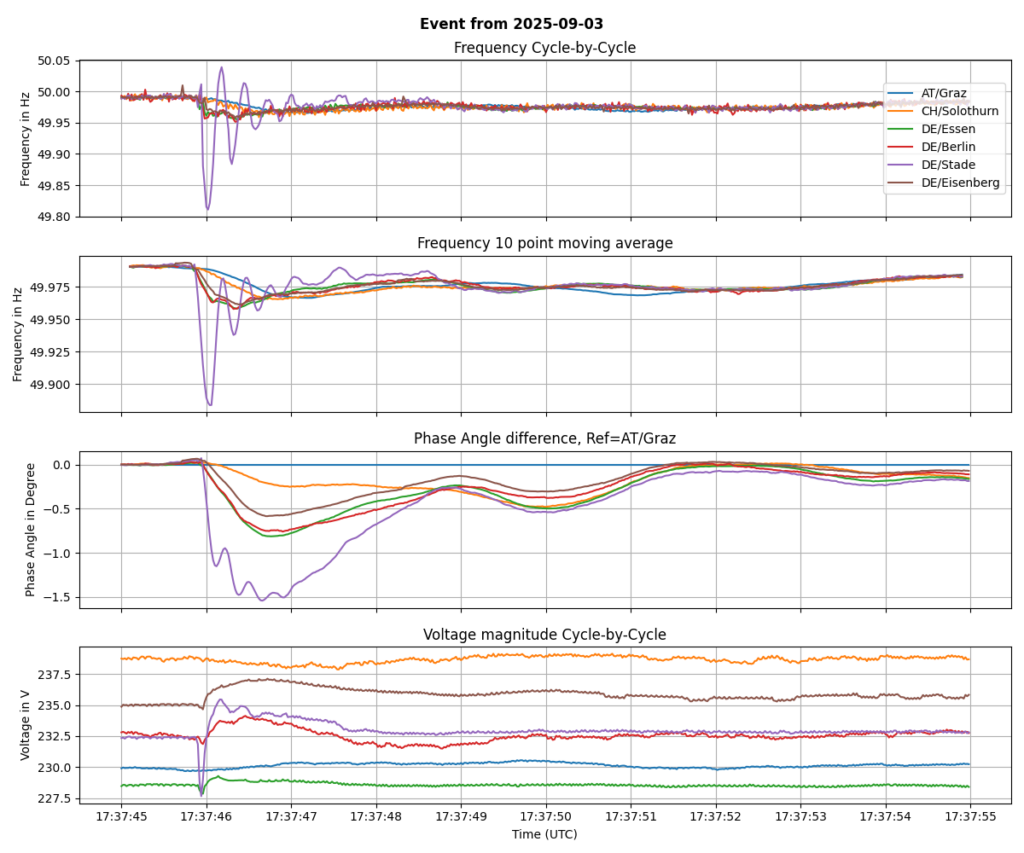
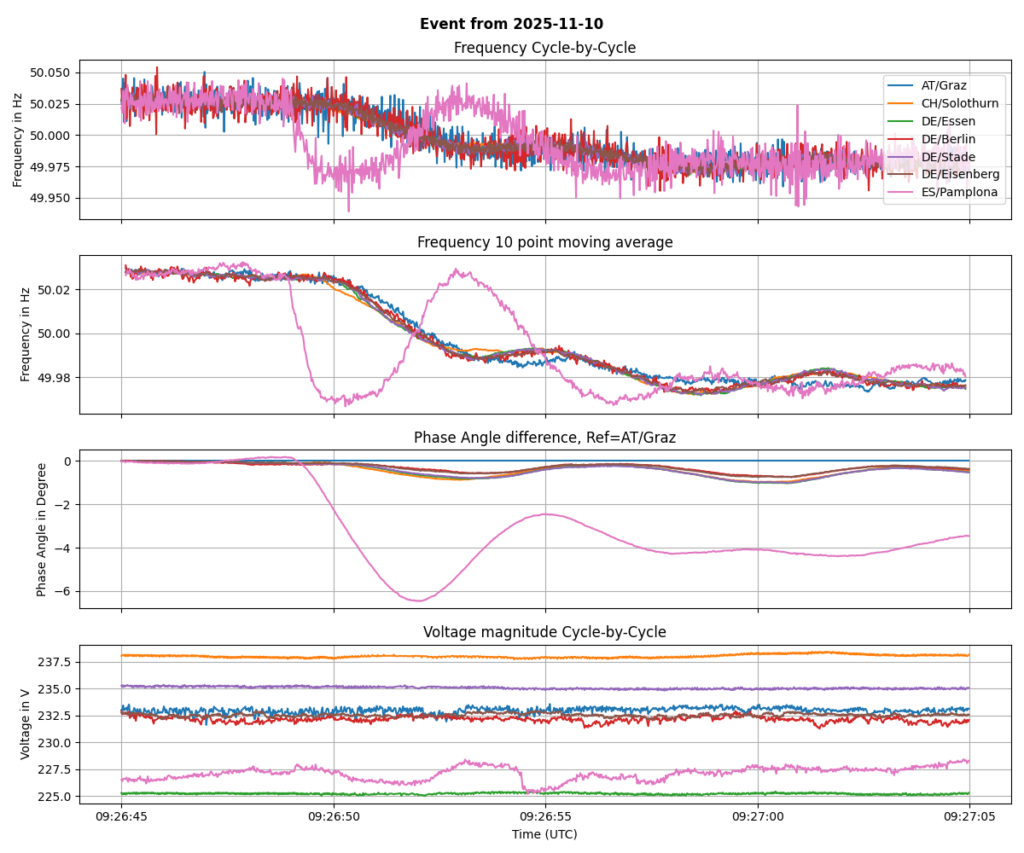
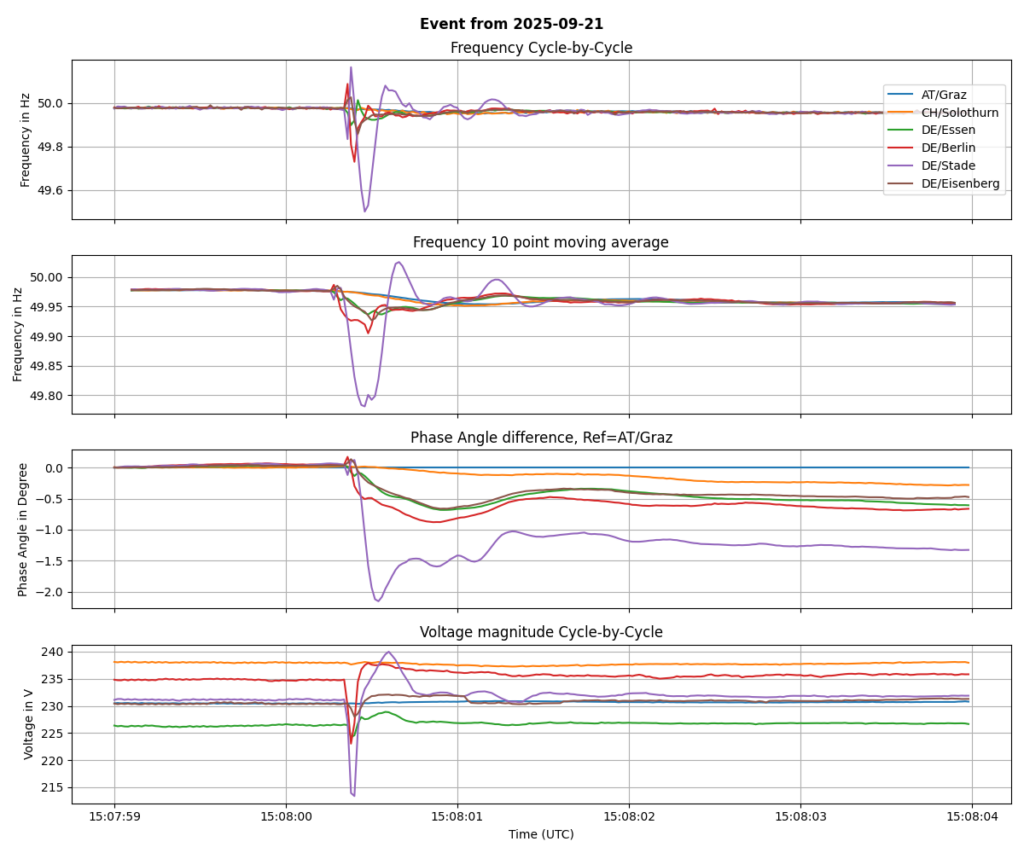
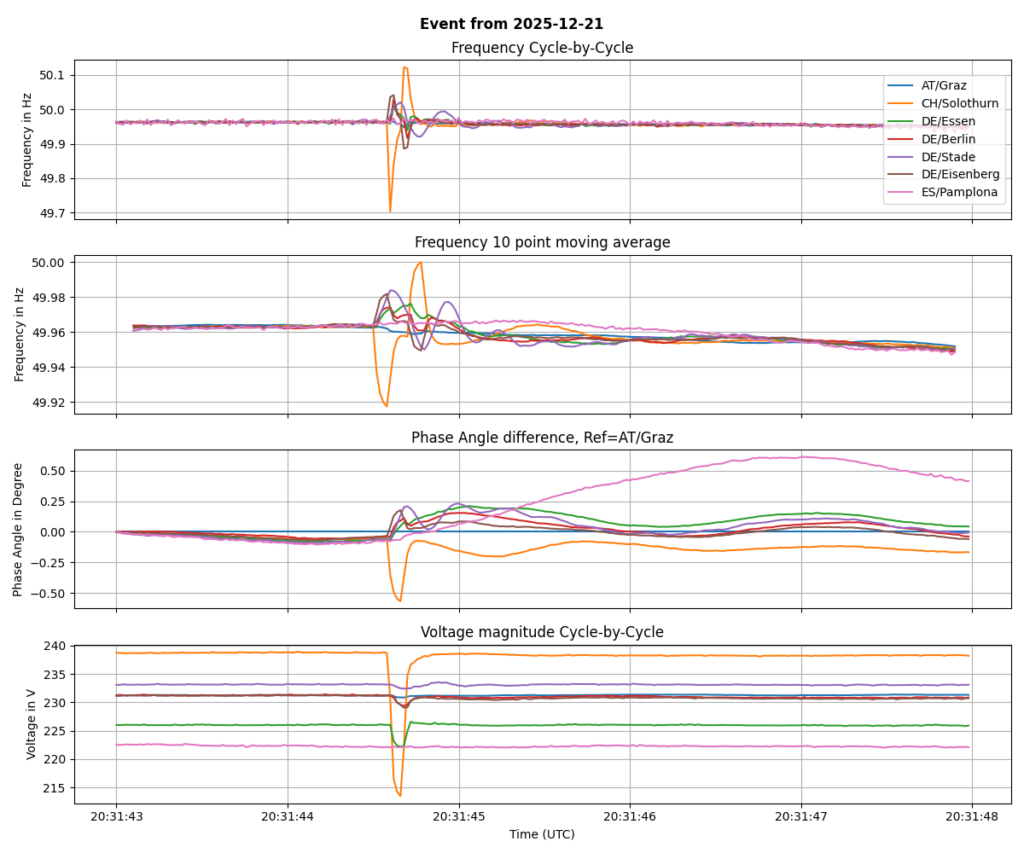
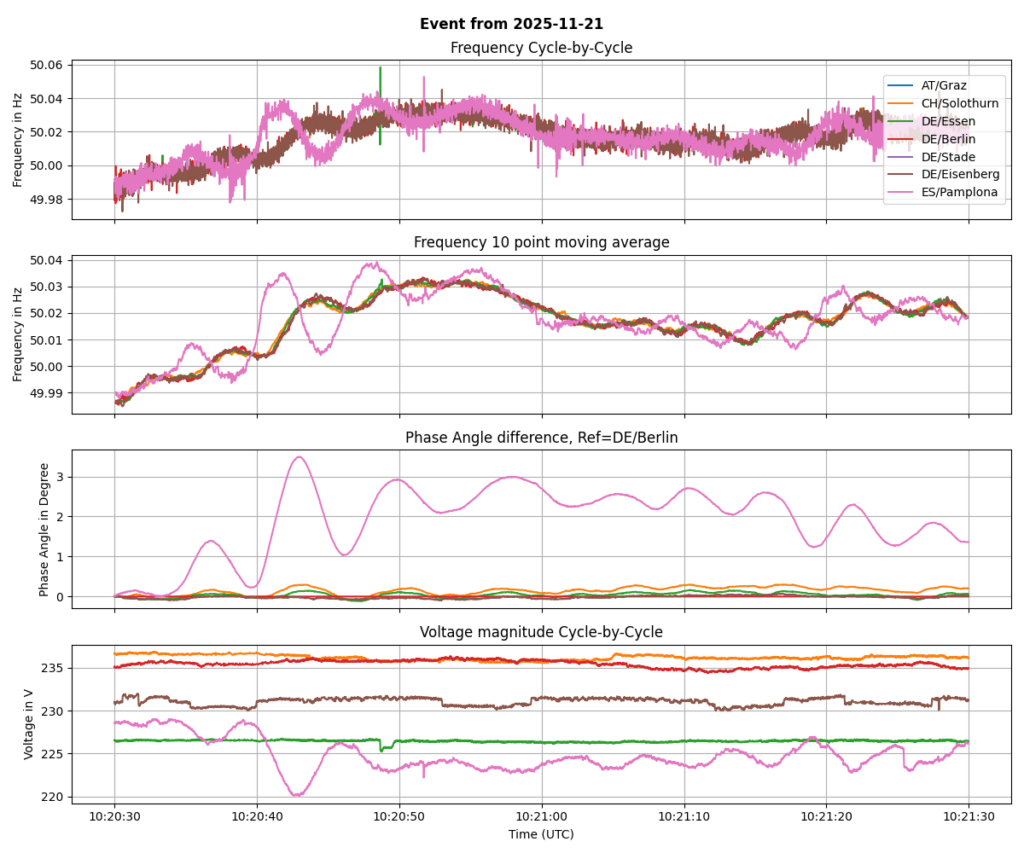
In this section I present some major events I’ve seen in the data so far. The plots are arranged the following:
- Frequency cycle-by-cycle data
- Frequency cycle-by-cycle data with 10 point moving average window for smoothing
- Phase angle difference: Calculated out of Frequency difference to nominal frequency
- Voltage cycle-by-cycle data
Frequency Jumps (2025-08-10)
Generation outage (2025-11-10, 2025-09-03)
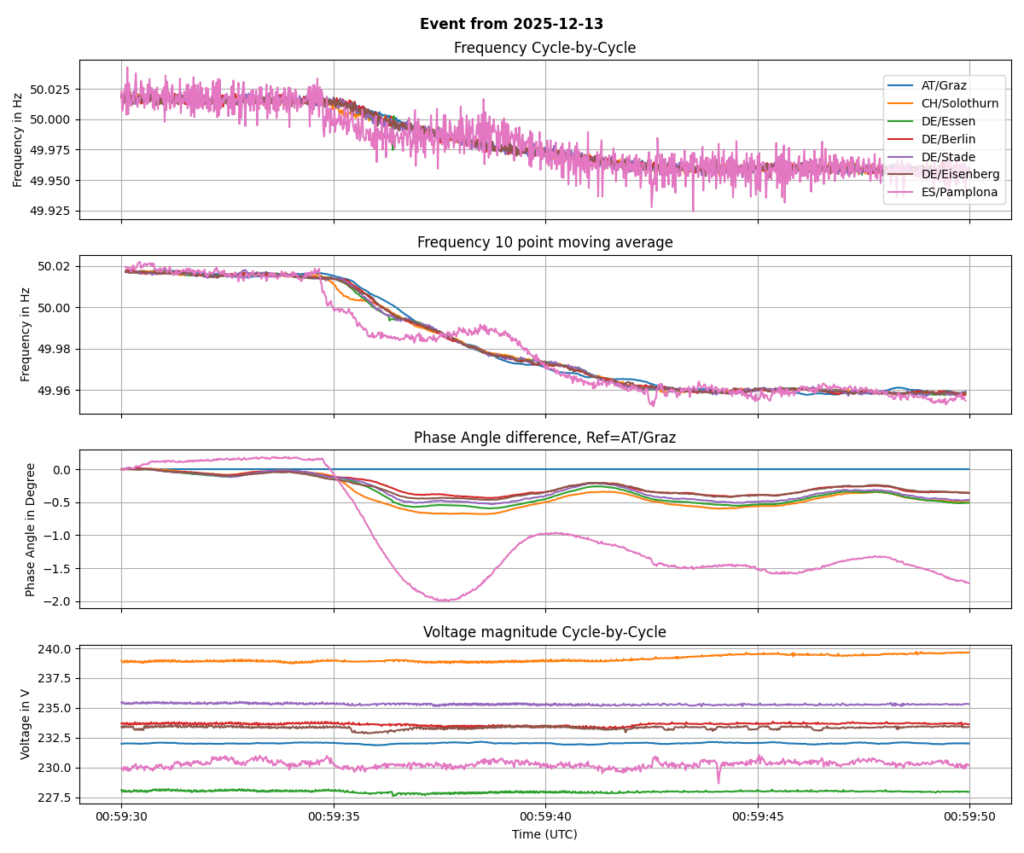
Frequency and Voltage Event (2025-09-21, 2025-12-21)
Steady state oscillations (2025-10-05)

Burst Oscillations (2025-11-21)
Power Quality
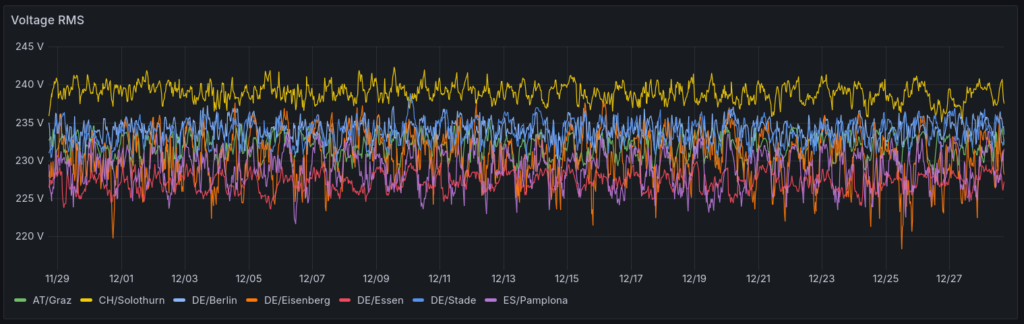
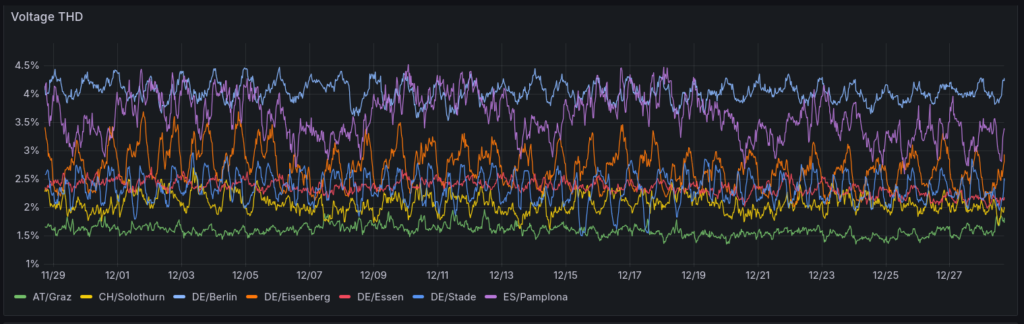
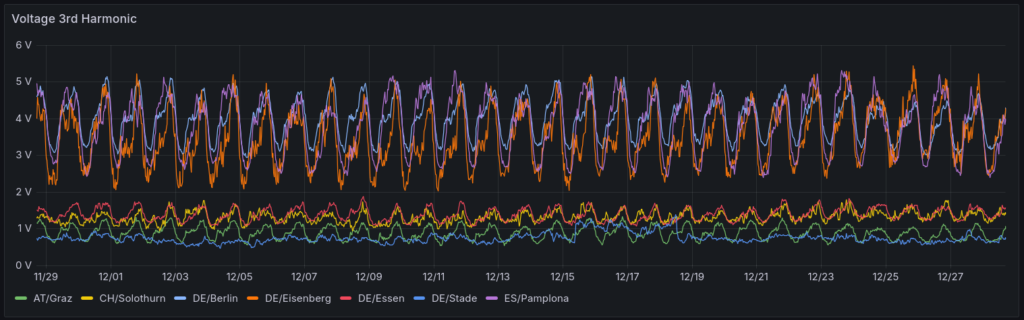
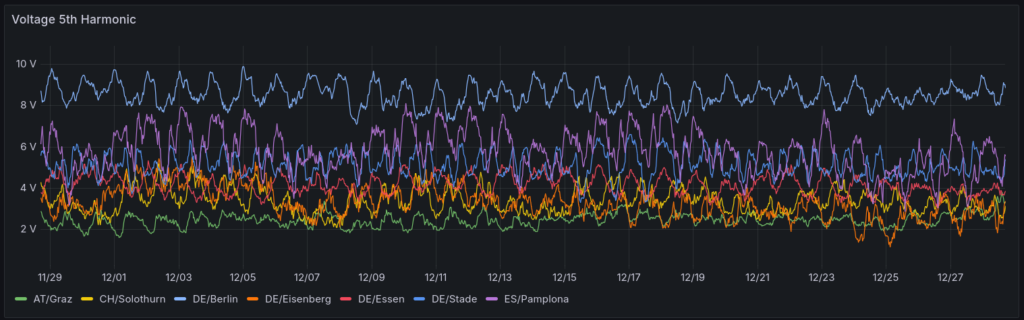
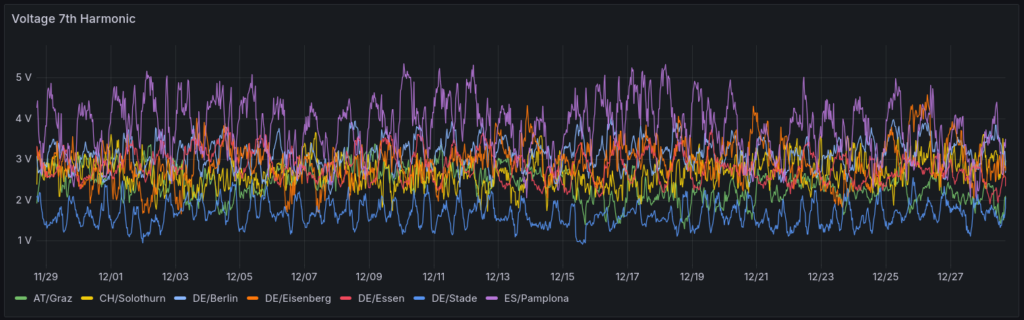
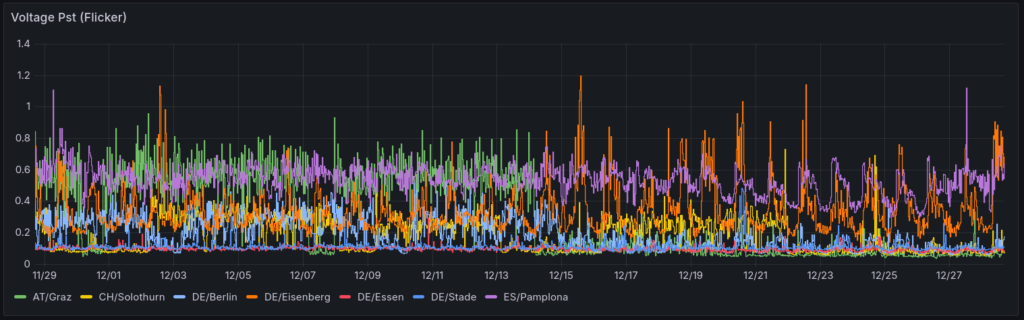
The major parameters of power quality, additional to the frequency, are recorded as well. Here is a short comparison of the 30-day data from the different locations. The interactive dashboard can be found here. The data is recorded in 10-Min interval.
Voltage Magnitude
THD
Harmonics
Flicker
Actions for 2026
1. Expand the measurement network
I want to expand the monitoring network to cover more of the Central Europen power grid. The next locations in the pipeline are:
- ES/Mondragon: A second measurement location in Spain
- ME/Podgorica: First location in south-east Europe
- FR/Montelier: First location in France
2. Become more visible
The PQopen project is very important to me and I want to increase its visibility. I’m working on a plan which includes collaborating with research organisations such as universities. My goal is to provide interested people with in-depth insights into the dynamics of the European electricity grid.
If you have any fresh ideas or contacts that could help me achieve this goal, please share them with me.
Thank you for an exciting year in 2025 and for the cooperation of the device hosters! Without you, this network would not exist. Let’s start 2026 with renewed energy and curiosity about how the transformation of the European power system will impact grid operations.
Yours, Michael